RSU Dashboard and Equity Compensation Tracker
Free Google Sheet Dashboard to Help Understand Your RSU Equity Compensation
I have always wanted a custom dashboard that visualized the stock/equity portion of my total compensation. One that was always updated based on current stock prices and could tell me how much income I would receive going forward. That is why I created the FAANG FIRE RSU Dashboard (Mobile Friendly Version).
This is the dashboard I always wish I had. Particularly in 2022 where we have seen drastic drops in tech compensation due to large swings in value of most tech stocks. I also added a “RSU Hold vs Diversify” tab which will help visualize the historical difference between never selling your RSUs and diversifying.
Helping tech workers understanding value of their RSU’s is incredibly important to me. I hope these dashboards do just that.
FAANG FIRE RSU Dashboard
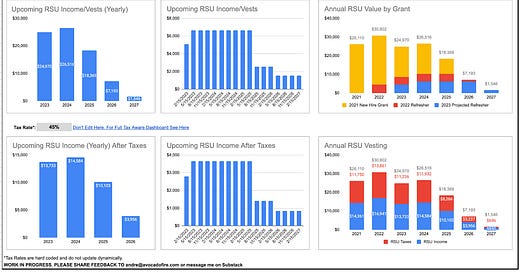
Here is a look at the primary RSU Dashboard. I’ll explain how to add your data and what each section means below.
RSU Hold vs Diversify Dashboard
The RSU Hold vs Diversify tab helps you visualize the overall difference overtime of never selling your stock vests aka “Diamond Hands” vs instantly selling and diversifying aka Diversification.
RSU Dashboard Setup
The default dashboard is populated with RSU data that was created for the “New Grad FAANG Engineer’s Path to FIRE” series. The data should simulate the RSU grants to a Meta engineer who joined the company in May 2021. It is all just placeholder data and the real magic happens when you add your own data.
“Insert Data Here”
In order to use the dashboard you will want to update it with your own data. The “Insert Data Here” tab where the raw data that powers the dashboards lives. It should be the only tab where you need to enter data.
The first step to populating the dashboard with your own data is to make a copy of the dashboard. To make a copy you will need to be logged into a google account. Then simply go to “File” and then “Make a Copy” as shown below. After this step you will be the only one with access to the newly copied dashboard.
Once you have your own copy of the dashboard it is time to add your RSU data. This sheet takes in all your equity vests to power all the dashboards. The primary thing you will need to update is the Company Stock Ticker in K11, followed by your Vesting Date, Shares Granted, Date Granted, Vest Description for all your RSU vests starting in Row 20.
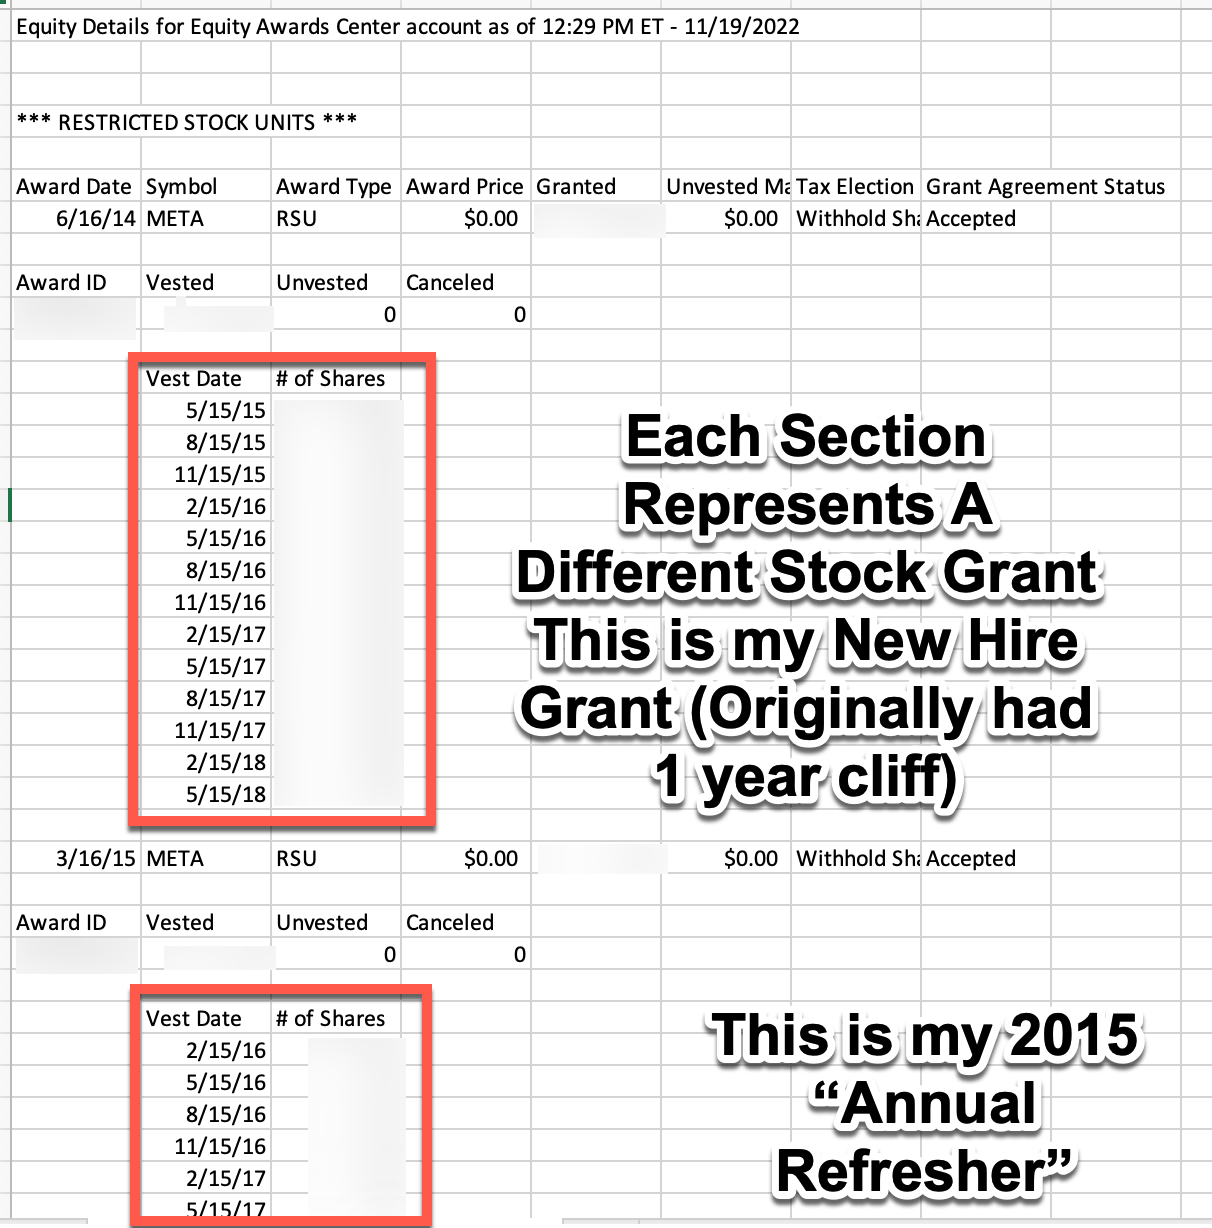
There is some data entry required here but most of it is just copy and pasting your RSU data from whatever broker your company. Below is a specific example of how a Meta employee would access the information needed.
How To Access This Information
Meta Employee Example (May be similar if your company uses Schwab)
Go to Schwab > Equity Awards > Equity Details https://client.schwab.com/app/accounts/equityawards/#/equityTodayView
Check “Show All Historical Awards”
Click “Export” in the top right to access the raw csv
The “Vest Date” and the “Shares Granted” can be copied directly from the exported CSV. For each section you will want to add the data for the “Date Granted” (which is the Award Date in the CSV) and give each vesting section a description. For Meta employees the easiest will be naming your first grant “New Hire Grant” and then each refresher with the year to help distinguish the different grants (ie “2022 Annual Refresher”).
Want 1:1 help setting up your dashboard?
For a limited time, all “Founding Members” of FAANG FIRE can get 1:1 help setting up their RSU dashboard along with a 1 hour 1:1 walk through to discuss your FIRE goals.
I also have more holistic FIRE packages available for those that want to partner with me to identify their FIRE goals and create an action plan on how to achieve it. Together we will outline your personal goals, make a plan to reach those goals, create a 2 year projection of your income and savings personalized for you.
Estimated Tax Withholding
One request I was getting while collecting feedback on an early version of the dashboard was that people wanted a simple way to visualize and compute the data after taxes. You may have been disappointed in the past when your shares vested and the number of shares that ended up in your account was drastically lower than your total number of vesting shares. This is likely due to the broker auto-selling shares to cover taxes. What I would do here is calculate the percent that was auto-sold in your most recent vest and update C14 with that percent.
I could dedicate an entire post on RSU taxes so I don’t want to go into too much detail here, but I covered some of the details in my post on “Shocked by Your Tax Bill”.
After entering this data the entire rest of the RSU Dashboard and RSU Hold vs Diversify Sheets will update!
Let’s walk through each tab and the different sections.
RSU Dashboard Tab
“Total Unvested RSUs”
This section will show you the total number of unvested shares and the current value of those shares. This will automatically updated based on the current share price. Your “Unvested RSUs” are the shares given to you but are not yet owned by you until they pass their vest date.
Upcoming & Prior Vests
Upcoming Vests
Upcoming Vests shows you the current value of the next four vesting dates. Current Value is calculated by multiplying the number of shares that are vesting on that date by the current price of the stock.
Prior Vests
“Prior Vests” will show you your last 4 vesting dates. I included the stock price at each vest date here to help understand why the value varies even though the share counts could be similar. In this case Meta was at $221 4 vests ago while at the most recent vest this November Meta was trading at $117.
Upcoming RSU Income/Vests (Yearly)
This graph gives you an annualized view of all your unvested RSUs grouped by the year those shares would vest. The values are based on the current stock price. Important to note this is only unvested RSUs. So if you have shares that have already vested for a year shown that amount will not be seen here.
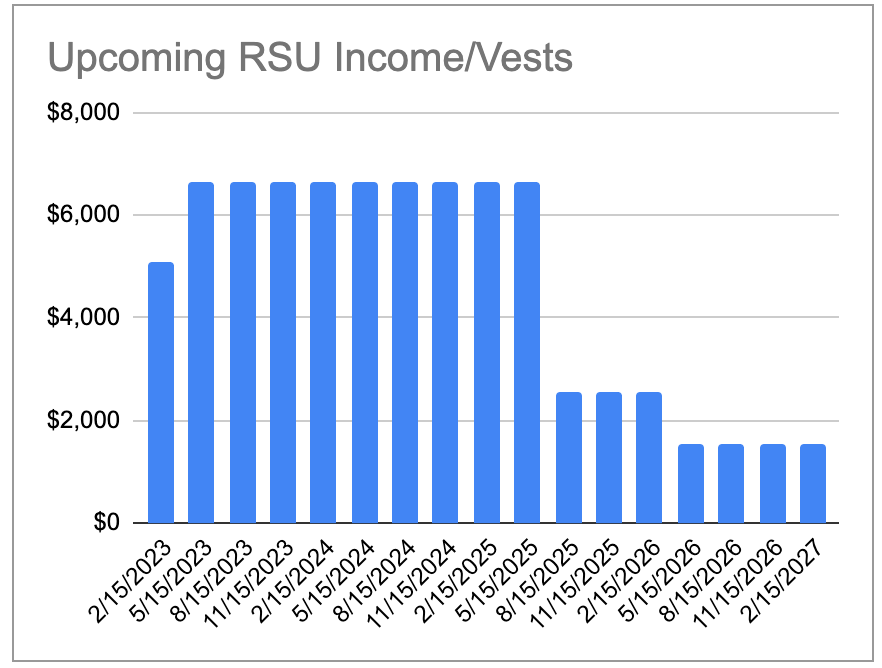
Upcoming RSU Income/Vests
Similar to the previous chart, this shows all unvested RSUs grouped by each vest date. You can hover over any of the dates to see the specific numbers as well as see the next 4 vests in detail in the “Upcoming Vests” section.
Annual RSU Value by Grant
This is one of my favorite views. It shows you your RSU income by year both for past vests as well as future vests grouped by each grant. The grants are pulled from the data you entered in the “Vest Description” column.
All future vests are valued at the current share price while all past vests are valued at the price of the stock on that day. In the above example you can see I added in “2023 Projected Refresher” based on my personal estimate. Each company does vests differently. This is completely optional and Meta employees should receive actual 2023 refreshers in February.
Tax Aware Estimates
The next 3 charts are using the tax rate you entered in C14 of the “Insert Data Here” tab. Remember this is not calculating actual taxes. It is an attempt to help you better estimate the actual amount of money you can expect to see hit your broker when your shares vest.
The first two graphs are mirrors of the ones above them with each vest reduced by the tax rate. Remember not to edit the tax rate in this tab, it needs to be updated in the “Insert Data Here” tab.
Annual RSU Vesting (w/ Taxes)
This graph shows you your annual RSU income with the tax percent explicitly shown. Again this is all based on the rate you previously entered and isn’t more complicated than that.
RSU Dashboard Tax Aware Tab
If you were looking for a dedicated tab with all the details at the top of the main RSU dashboard with taxes removed the “RSU Dashboard Tax Aware” tab is for you. It is the exact same as the first tab but has taxes removed.
RSU Hold vs Diversify Tab
The RSU Hold vs Diversify tab helps you visualize the overall difference overtime of never selling your stock vests aka “Diamond Hands” vs instantly selling and buying a total market index fund aka “Diversification”.
This dashboard will be familiar to long time subscribers. I originally shared this as part of a post on “Holding Vested Stock vs Diversifying”. I made a few updates from the original post. Previously the dashboard would not reliably update based on the current price of the stock and now it does a much better job. There is also a new tab that utilized the tax rate you entered previously to give a more accurate representation of the difference.
How the values in this tab are calculated are by taking each vest date and translating the value of the vest into shares of VTSAX, Vanguard's low fee total market index fund. You can change the underlying diversification stock in C12 of the “Insert Data Here” tab.
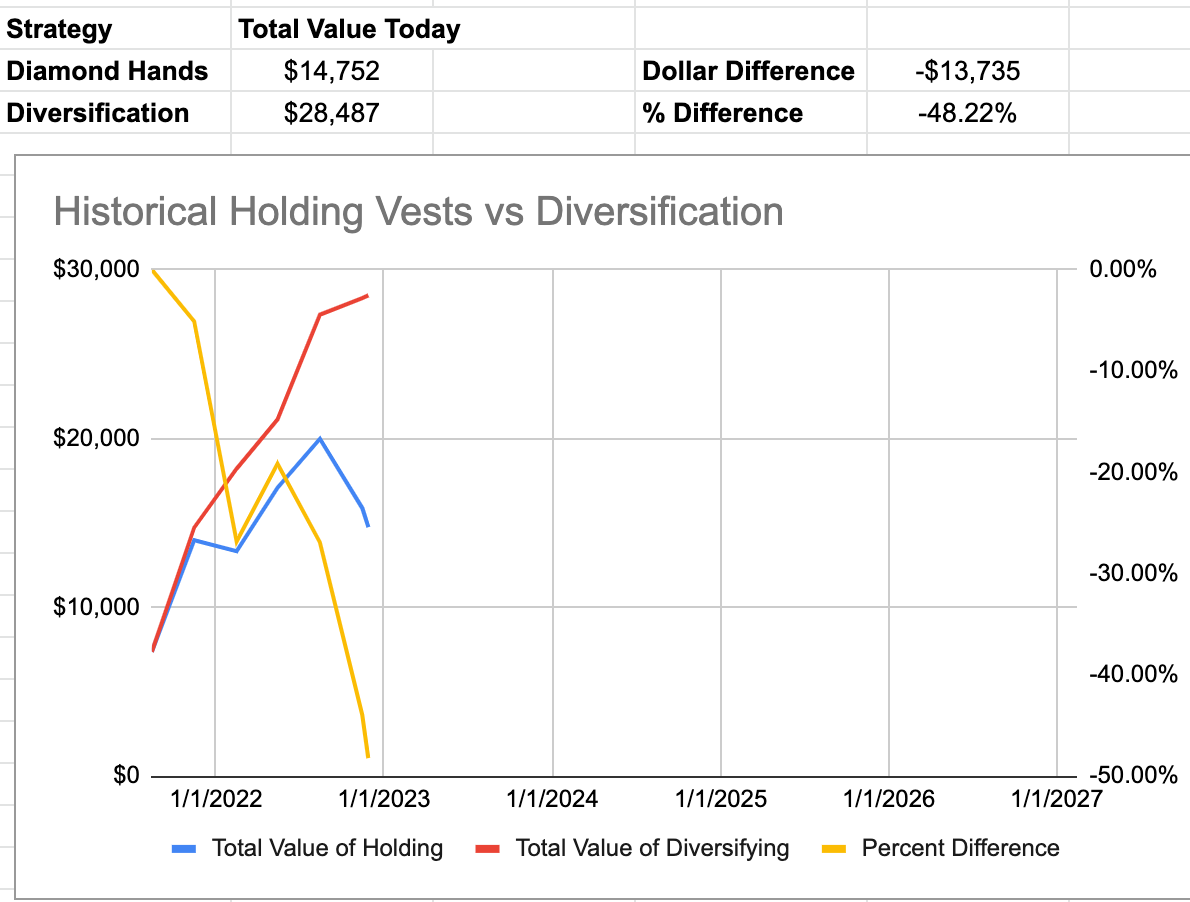
Historical Holding Vests vs Diversification Graph
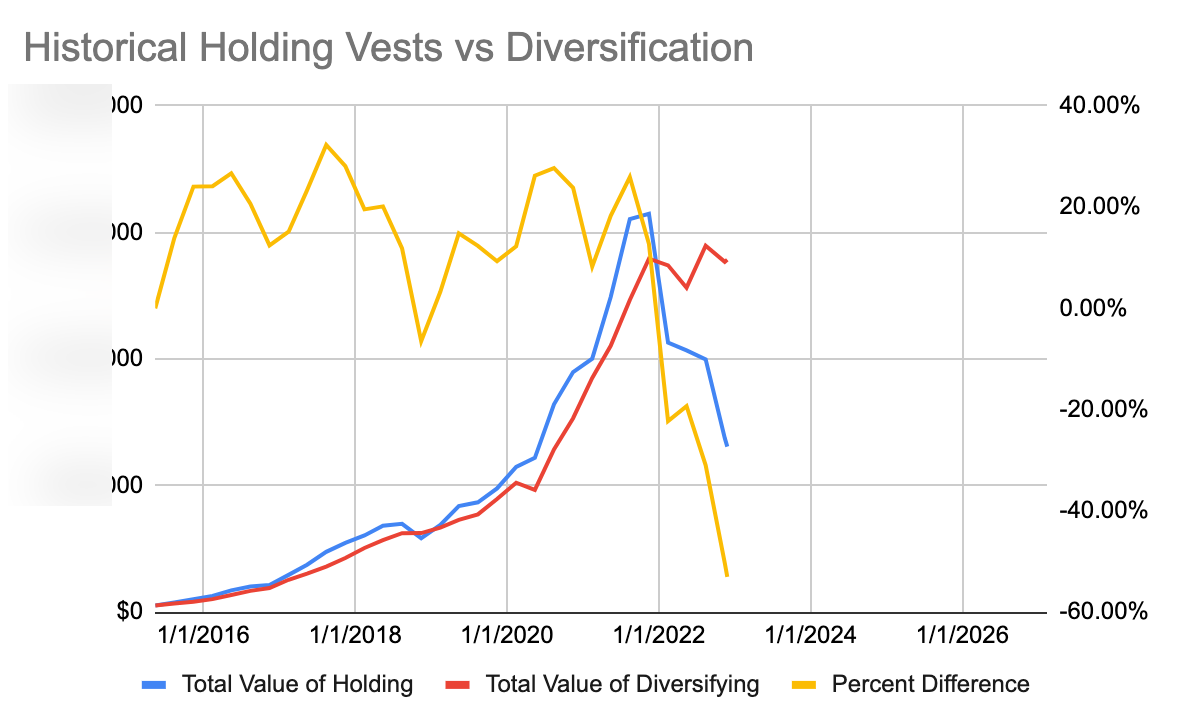
The Historical Holding Vests vs Diversification graph shows the value at each vest date as well as todays date for never selling your vests and always selling + diversifying. It also shows the percent difference between the two strategies in yellow which is charted on the right axis.
In the placeholder data, which is attempting to estimate real data for a new hire from May 2021, diversifying has always led to higher total returns. As much as a 50% difference as of today!
Above is how my own data looks. It shows that up until 2022 holding META shares and never diversifying would have yielded a larger balance… until it didn’t! I have always sold my META shares as soon as they vest. I am not selling because I want to beat the market though. I am selling because I want to reduce volatility and more closely match the overall market. By nature of my employment I am long Meta. All my unvested shares continue to ensure I have significant skin in the game.
Total Value Difference Between Holding vs Diversifying Chart
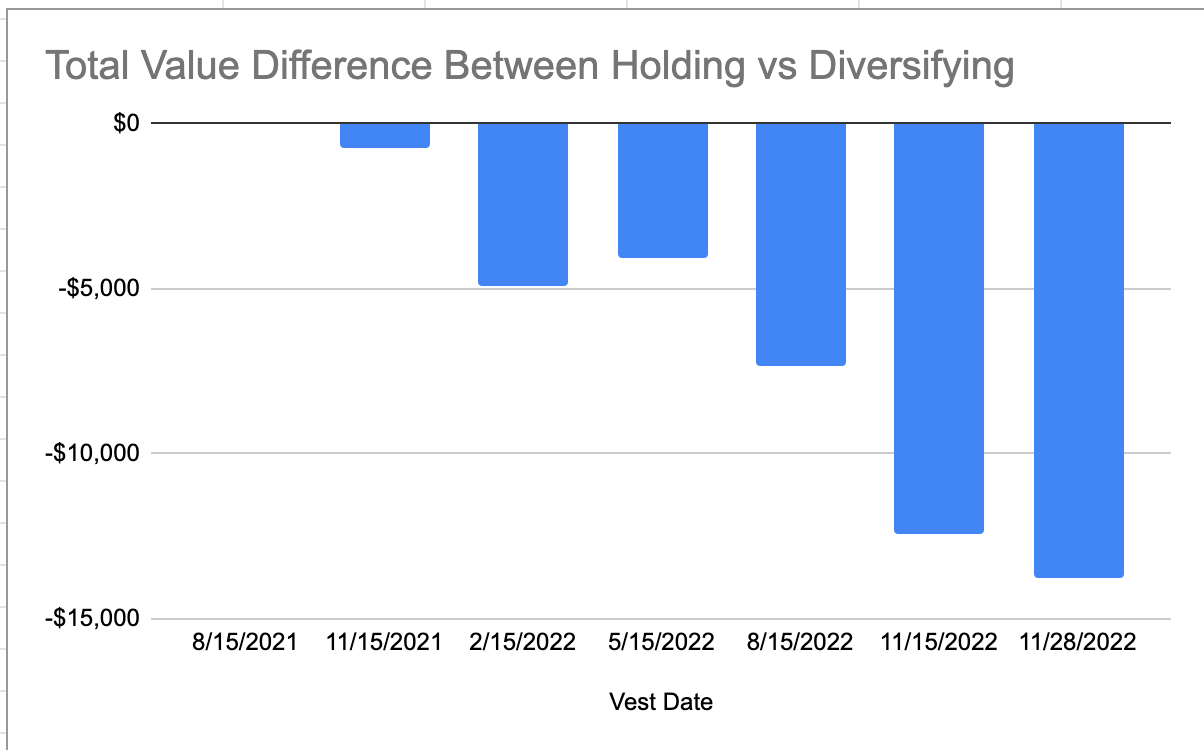
The Total Value Difference Between Holding vs Diversifying chart is showing the total dollar value difference between the two strategies at each vest date as well as today.
RSU HvD Tax Aware Tab
The RSU HvD Tax Aware tab shows the exact same information as previously covered with the key difference being that it is reducing each vest by the tax rate you previously entered. This should give a much more accurate representation of the actual dollar difference between holding and diversifying.
Looking for what to read next? Learn about how I calculate my “Enough” FIRE number.









Thanks Andre for sharing this dashboard! This is super helpful in understanding the % difference between holding and diversifying! Looking forward to more informative posts from you.