The Analysis into Leaving San Francisco
A numeric approach into thinking about relocation and remote work possibilities.
I am leaving San Francisco.
Well, I am eventually leaving San Francisco. My plan was always to earn a lot of money, save a lot of money, and then pull the plug and FIRE (financial independence and retire early) in a lower cost of living area (ie pretty much anywhere else). While I am close, I am not quite there just yet.
That was the plan anyway. Then 2020 happened and everything changed. Suddenly companies drastically changed their approaches to remote work. That meant that you could suddenly work for major players in the tech space without needing to be in a major (and HCOL) tech city. Since my personal plan always involved leaving, the prospect of being able to relocate before I FIRE while keeping much of my San Francisco salary was incredibly alluring.
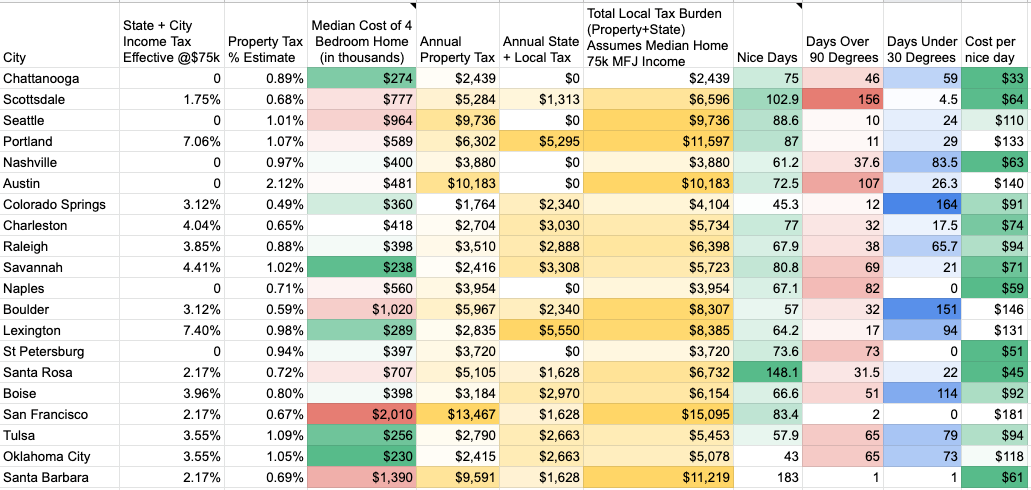
I then did what I always do next in situations like this. Open up Google Sheets and start mapping out scenarios. The key analysis was around costs of different cities based on taxes, housing, and an important factor for me, the weather. I modeled out two baseline scenarios. One based on a family earning $75k per year (to simulate my FIRE goals) and another on a family earning $500k (placeholder for high earning tech couple).
2022 Edit: See the updated version of the FAANG Remote Work City Analysis.
Quick caveats. This spreadsheet assumes equal salary in every location. Every company is approaching compensation differently (although I have found Facebook’s salary changes extremely favorable towards moving remote, particularly at more senior levels). I’ll also explain the weather piece a little bit further down.
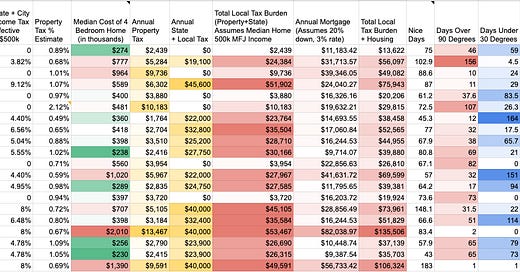
Narrowing in on”Total Local Tax Burden + Housing”. This estimates your starting costs for living in these cities, at the given salary, factoring in the median cost of a mortgage + property tax on a 4 bedroom home (I know for places like San Francisco a 4 bedroom assumption is on the silly side). The housing costs here are based on 2020 as well, COVID has inflated these even more. If there is interest I can go through an update numbers. I link to the raw spreadsheet which you can make a copy of at the bottom of the newsletter.
My personal take away… while earning high salary it is tough to beat states without income tax. Just keep an eye on those property taxes, they can sneak up on you in places like Austin. Or you can get a gut punch in Portland with both high income taxes and property taxes. The other thing I was in Lexington. Their flat tax is incredibly regressive, earning $75k leaves you with one of the highest local+state tax burdens out of any other city I looked at.
The weather! As you can see there are large swaths of the country missing from this analysis. The one major thing I came to appreciate about San Francisco was the weather… or really the lack of extreme weather. If I was picking somewhere to live it felt important to try and factor that in. I pulled in average number of extreme hot days (>90 for me) and freezing cold (30). Then I found this article by Brian Brettschneider on ranking cities based on “Nice Days”. His definition was based on moderately warm temp, partial sunshine, minimal wind, low humidity, and no rain. After reaching out to Brian over twitter he was kind enough to share with me his own spreadsheet which I used for my “Nice Days” column. As you can see the California coast south of San Francisco through to San Diego has a real monopoly on nice days. I then divided the cost by the number of nice days a city had to give me a sense of how much I am paying for each “Nice Day”.
This was a helpful exercise for me mostly as a way to eliminate cities. It also helped me think about the intangible a little more. It also gave me greater insight into the impact of state/local/property taxes at different income levels. Take Santa Rosa California as an example here. Someone earning $75k and living in a $707k house would pay $6,732 per year. Lexington, Kentucky on the other hand would have that $75k earner paying $8,385 even though they would be paying property tax on a home at $289k.
If I do decide to work remote and heavily base my decision on costs and weather I would be hard pressed not to choose a zero state income city. Then as I approach FIRE the impact of income tax becomes much lower (even lower than the estimates due to the income not being w2). So perhaps if my plan was to FIRE after a few years it would adjust the decisions (ie I could rationalize paying $20k more per year to live in Raleigh vs Nashville if I ultimately wanted to FIRE in Raleigh after 2 years anyway (where the difference in cost then drops to <$3k per year).
Here is my Tech Worker City Relocation Analysis spreadsheet that you can make a copy of to use as a starting point for your own analysis. You can see my future plans to include quality of schools, direct flights to family, bonus for major airports, factor in % of county that voted for….
Shoot me a tweet @drenader if you had thoughts or questions.


Just seeing now. This is great!
Loved this. Hoping that you will update the sheet to include quality of schools, direct flights to family, bonus for major airports, conservative/progressive/women's rights, & factor in % of county that voted for, cost of living, traffic, etc.