What City Do You Move To for Remote Work or FIRE?
A refreshed analysis for 2022 of how different cities across the country rank for remote work and FIRE.
How do you choose where to live?
So you can go work remote now… the ultimate question remains; Where Should You Live? If you could live anywhere in the United States how would you choose? Is proximity to family the primary factor? What about public school systems for your kids? Sure you will factor in housing costs, state income taxes, and you wouldn’t forget property taxes right? What about vaccination rates? The politics of the city? We also wouldn’t forget the most important factor at all, the weather (even if people tend to mentally overestimate its impact on satisfaction).
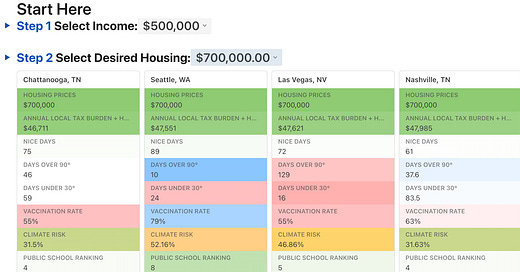
Naturally I once again put everything into a spreadsheet, I still play an analyst at work after all. I took things a few steps further than last years janky Google Sheets though. I used Coda.io to make the entire relocation analysis much more customizable. Simply open the Relocation Tool and select the closest Income in the drop down, as well as the desired housing in the second drop down, and the spreadsheet will automatically update (Note: If you are on mobile there is a more mobile friendly drop down you can click on to expand a card view). I also doubled the number of cities that were included to 39. You don’t want to miss “FIRE Mode” which allows you to model out the costs while working as well as when your income changes in your FIRE years.
The Full Relocation Analysis Tool
First things first! The Full Relocation Analysis Tool you can play with or make your own copy to customize it fully to your liking. There is a glossary of all the column terms. FIRE MODE which lets you run early retirement simulations. As well as full access to all the data used within the Data Sources page. Continue reading for examples of how to use the tool. You can reply to your subscription confirmation email with any city requests or ideas for new features.
Subscribe for free to request new cities and increase your financial wellbeing.
Andre, stop telling me about it and show me!
Ok, ok, here is what it looks like when you select $250,000 Income and the Median Home Price. All income tax rates are based on married filling jointly with all incomes >=$100k maxing out their 401k contributions. Median Home Prices are based on zillow data for the city/metro using the average of the last 3 months of 2021.
$250,000 Income & Median Housing
Low housing prices and mostly no-state income tax dominate the top 10. You have cold options, hot options, moderate climate risk, and some mid-level public schools. If you need to travel to both coasts frequently then Texas and Florida both present some good options.
The sheets are auto-sorted based on “Annual Local Tax Burden + Housing” which is calculated by adding up the following inputs:
Annual Mortgage costs based on set Housing Price assuming 4% interest rates
Annual Property Taxes (Property Tax Rate x Housing Price)
Local + State Income Tax: Total state/city income tax based on set Income
Simply make a copy of the sheet if you are interested in sorting by a different field (like Nice Days) or filtering down certain columns (like all cities with >40 days under 30 degrees).
$1,000,000 Income and a $2,000,000 Home
Let’s take a look at the top of the income and housing spectrum for the FATFIRE crowd. What city comes out on top for for a family with a $1,000,000 income looking to purchase a $2,000,000 home?
It may not surprise too many people that for high income earners, cities in states without an income tax topped everything. Another important thing to call out is that not all states without income tax are equal in terms of overall tax burden. Every Texas city included was last among the no state income tax group. Close behind though are states with low property taxes and modest income taxes at the higher end, mainly Colorado and Arizona.
$100,000 income and a 3-bedroom house?
At $100,000 the monopoly on top locations by states without income taxes goes away! Housing prices and property taxes play a much bigger role.
What if you just FIREed, or will shortly?
If you just FIREed, you can set your income for what your FIRE income is or what it will be. In FIRE you would have much more control over what your actual income is based on how you structure your withdraws. They could even be as low as $0. But let’s take a look at $50k taxable income and a $700k house.
Ohh, some different results! If you plan to spend a fixed amount on housing while having a more modest FIRE income property taxes become the main monetary factor. Colorado Springs, Charleston, Denver make the top three from a pure local tax and housing perspective. What is also interesting is that the actual spread between the best and the worst cities isn’t as drastic as you might think (although this would drastically change over time).
On that note it would also be worth understanding how property taxes can change over time. In California they tend to be fairly static (granted on typically much higher base values) while every where else I am familiar with has a process to reassess as often as each year. You should also note that at the bottom are Boulder, Santa Barbara, LA, San Francisco, Oakland. They are automatically dropped to the bottom because 1.4 x the set $700,000 housing price is lower than those cities median sales price.
FIRE MODE
The primary tables are excellent at giving you a view at a single year at a certain income, but what if you plan to FIRE soon? So modeling things out only for when your income is at its highest may not give you the full picture…. enter FIRE Mode. It works by allowing you to select your income both while working and when FIRE along with the time period for each.
$500k Income vs $500k Income + FIRE at $25k
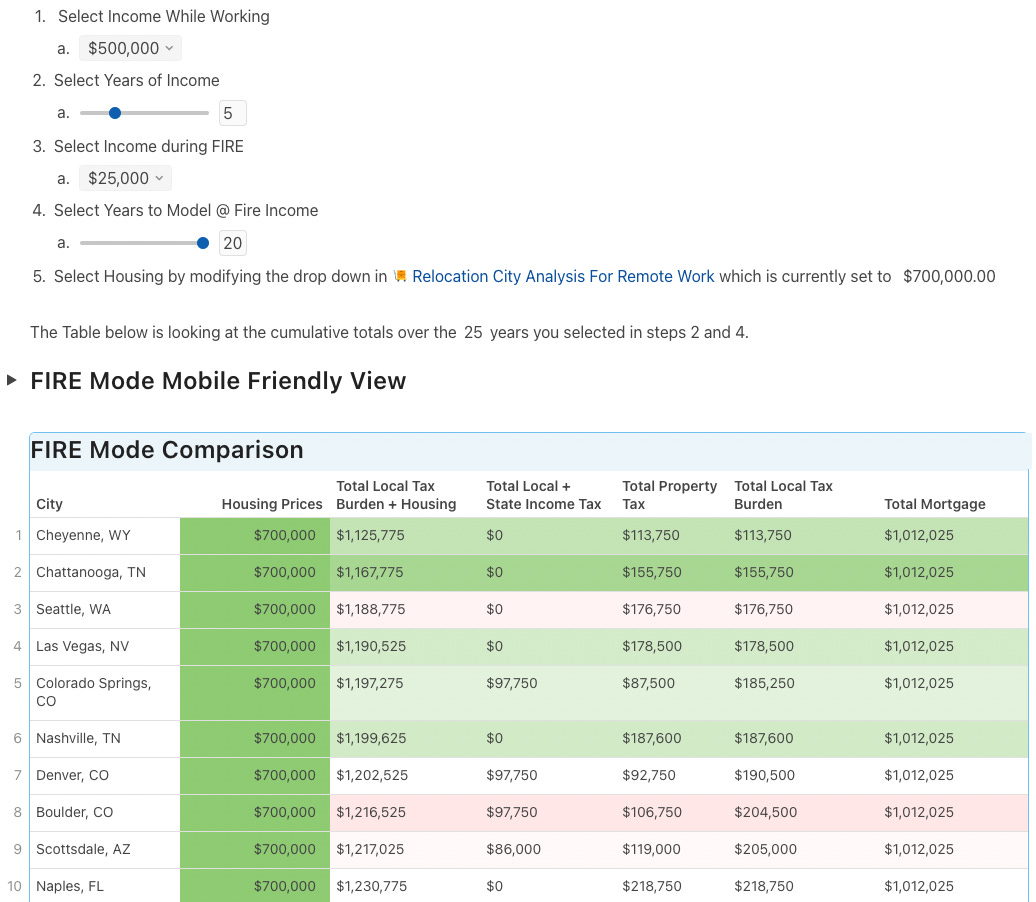
Here is a quick comparison of the top 10 cities for 1 year at $500,000 income and a $700,000 house vs 1 year at $500,000 and then 20 more years at $25,000 in fire also with the same $700,000 house.
FIRE mode is where I think things start to really get interesting. Depending on the mix of years left to FIRE you may find drastically different results. If you are a high earner the the number of working years left (even as little as 5) swings things back in favor of states without income tax with Colorado, Arizona, and South Carolina often creeping in.
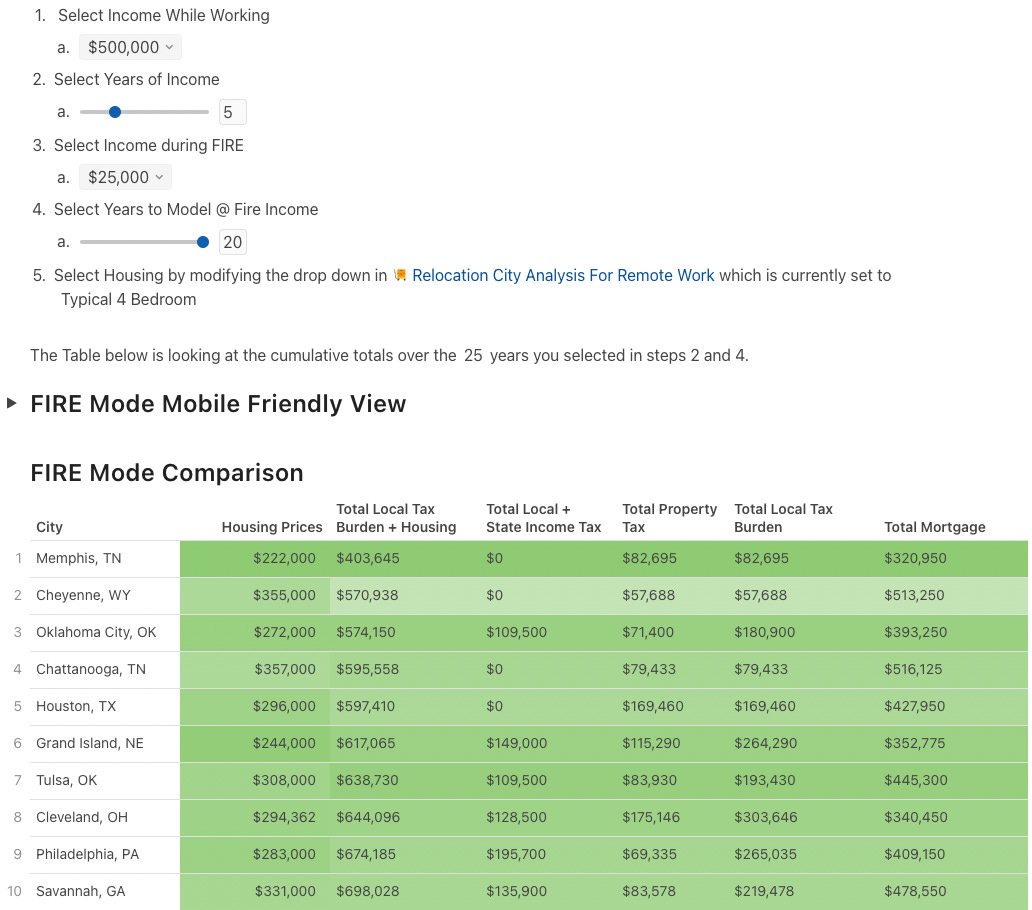
But then again… if you adjust the housing away from fixed amounts back to say a “Typical 4 bedroom” the housing prices swing things in a completely different direction.
What about my plan?
Once again I found the process of putting this together extremely enlightening. I also know the choosing where to live based on numbers in a spreadsheet doesn’t tell the entire story.
I have put in my application to work remote at Meta which I anticipate to go through in the next cycle. The lease on my rented condo is also up towards the end of May. There is a world where I actually move after May or another where i renew my lease for another year and just work from home in San Francisco. I keep gravitating towards the entire Raleigh-Durham-Chapel Hill area of North Carolina even though from a financial perspective it is consistently middle of the road. Good public schools, doesn’t get too cold for very long, low overall climate risk, decent airports, lots out outdoors make it very appealing… but I have never been. So I want to visit in the next few months. Nashville and Charleston are also high up there.
Perhaps a middle ground where I can go month to month on my rental as I figure things out. I have 1 more year till my daughter would start kindergarten which also acts as another cut off. The sad joke here is “What do San Francisco children of well of parents get for their 5th birthday? A new house somewhere else.”
If you enjoyed this, please consider sharing and subscribing. If you are feeling extra generous I would gladly accept a cup of coffee or an avocado toast. I am currently limited in number of cities I can add by the free version of Coda.io. If enough of you sign up for Coda by making a copy of the document or buy me a few coffees I’ll be able to add more.
The Full Relocation Analysis Tool you can play with or make your own copy to customize to your liking. There is a glossary of all the column terms. FIRE MODE. As well as all the data used in the Data Sources page.
So where will you live and what factors are most important to you? Leave your thoughts in the comments.


Hi Andre, I recent completed a huge research study on remote work, and analyzed things like how the # of remote jobs has been trending the past year, whether remote jobs are more common among senior leaders vs lower level workers, and how remote work culture correlates with work satisfaction.
I thought you might find some of the findings interesting: https://bloomberry.com/the-state-of-remote-work/ . Feel free to share/cite it if you feel it'd be useful to your readers
Hi, I noticed that Chicago, IL isn't included in the spreadsheet. That seems like a pretty big city to exclude. I'm curious to know if that was intentional or not?