I tracked the cost per wear of all my clothes for an entire year with sewn on NFC buttons. What does this have to do with FIRE? Honestly, very little. But I did promise this newsletter would include “and anything else I can fit into a spreadsheet”.
Why Did I Track My Clothing?
For some reason it really bothered me not knowing how many times I have used a specific shirt. I wanted to know how often I wore something, the cost per wear, when I last wore it. It was just one of those small things that stuck in my head for a few years. Plus I wanted to be able to use the data to inform what type of clothes I wore most and understand when spending more on clothes might make sense.
Here are some of the high level results after a year:
Current Wardrobe Value: $3,907.65
In 2021 I added 20 new pieces of clothing for $517.30 in addition to $271.34 worth of gifts.
Total donated items: 38 with an estimated retail value of $1,419.07 ($1,044.07 purchase price)
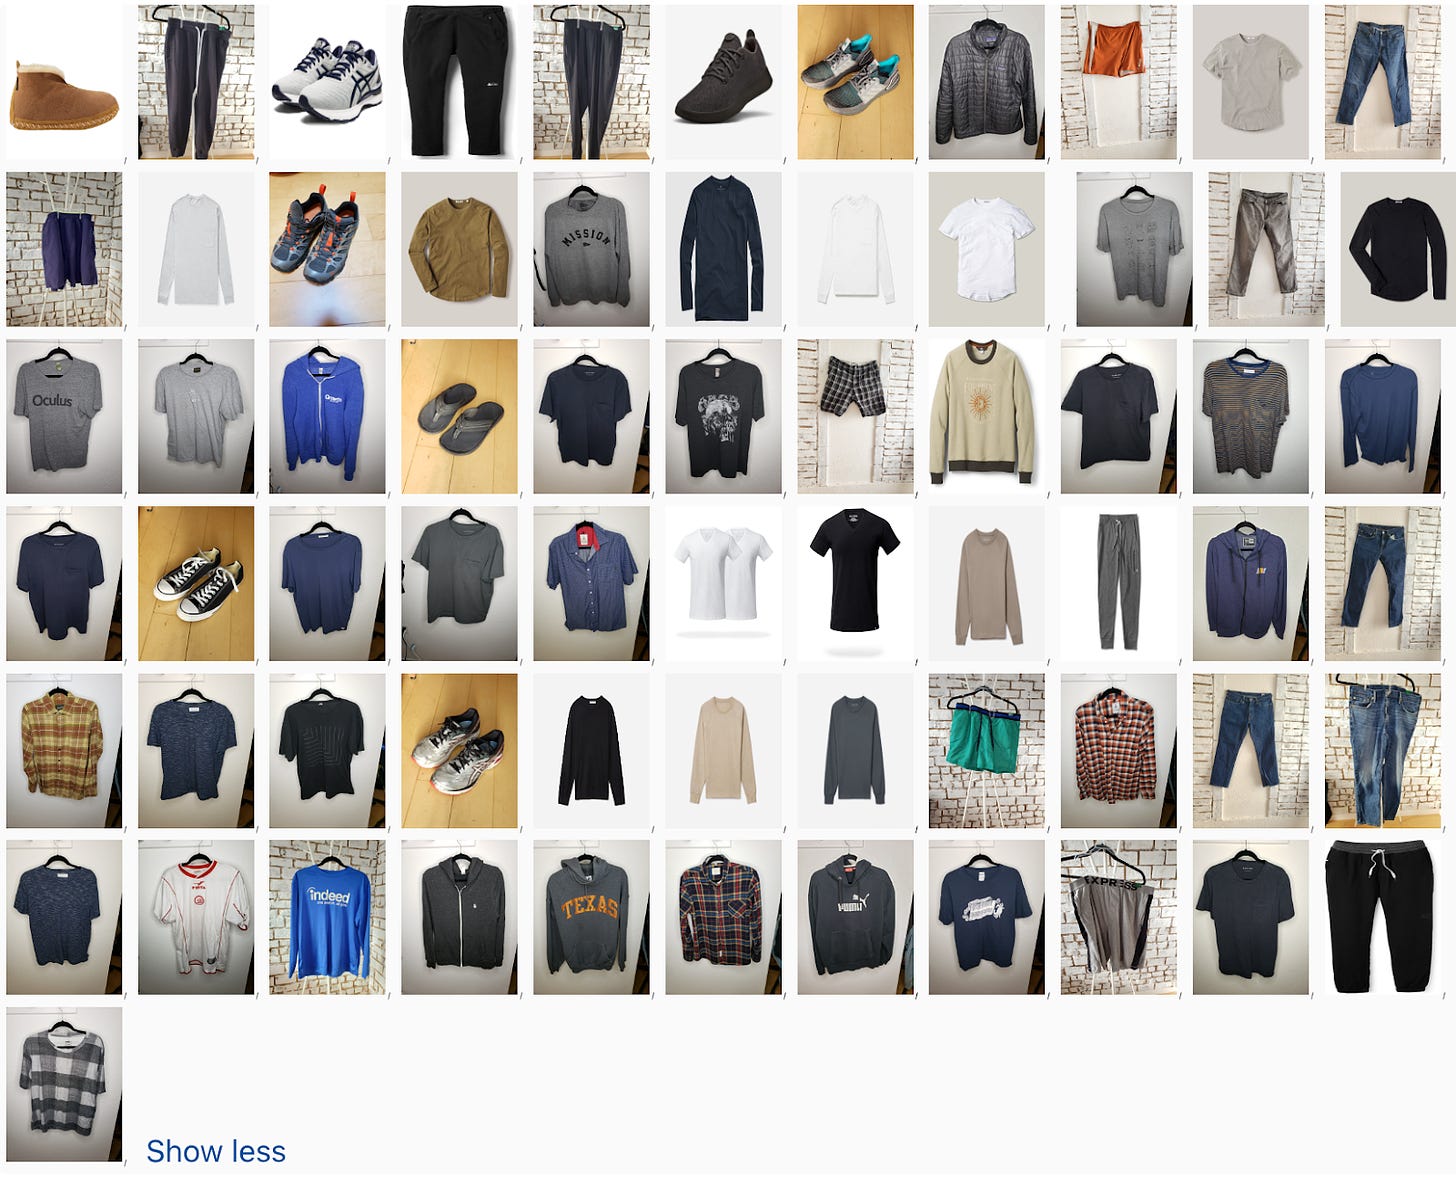
Here is every single piece of clothing I wore last year sorted by total wears (excluding socks and underwear… because even I draw the line somewhere). Worth highlighting here that I worked from home all of 2021 and some other global event caused me to leave the house less.
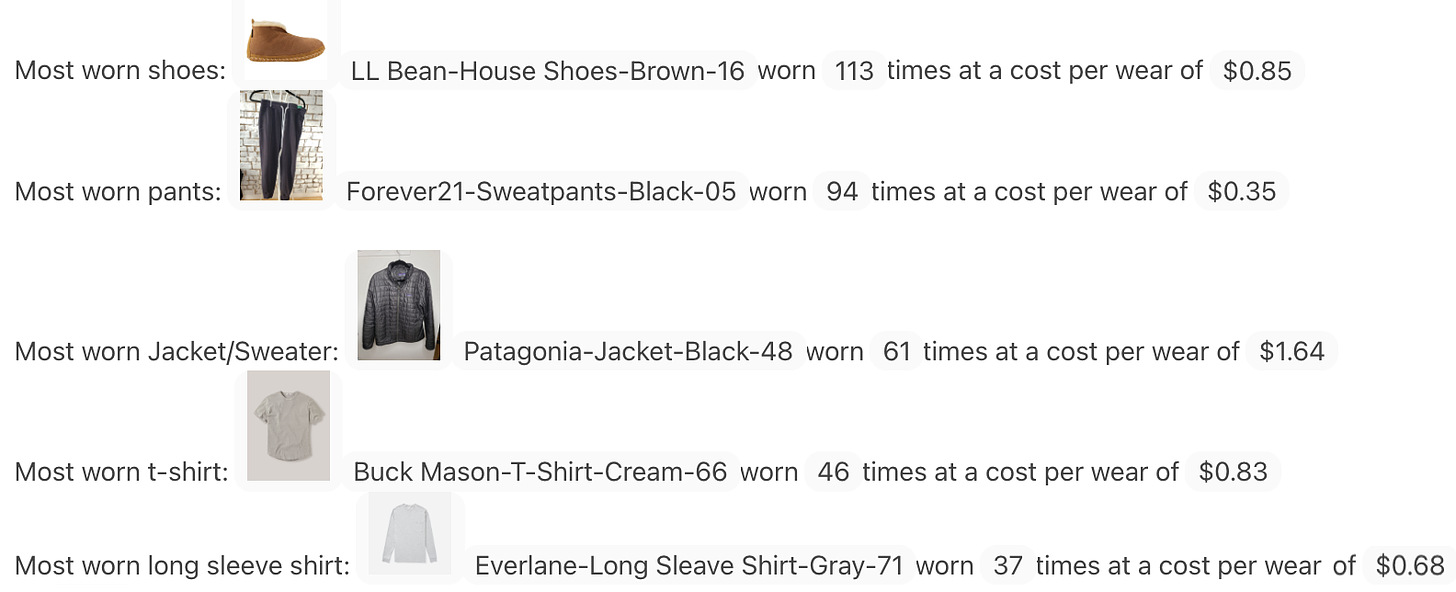
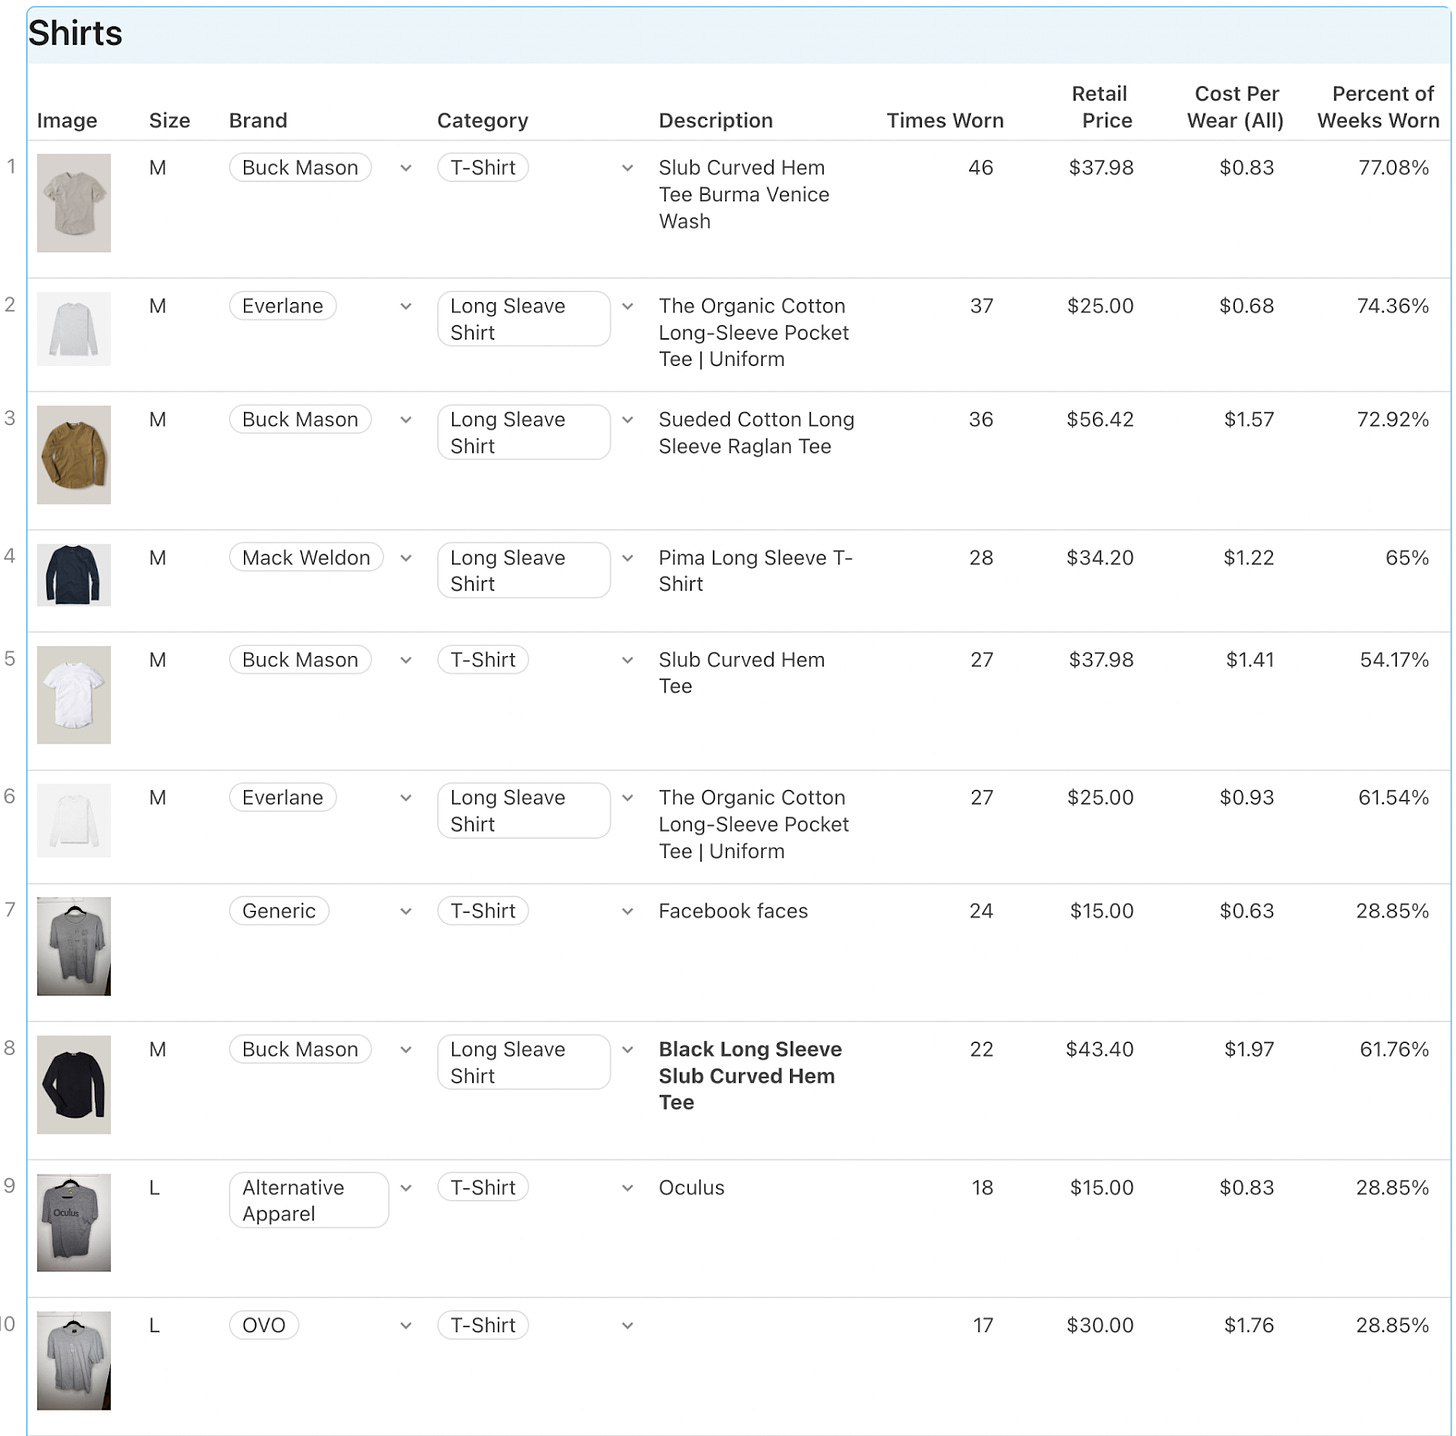
The Top Ten Most Worn Items Overall
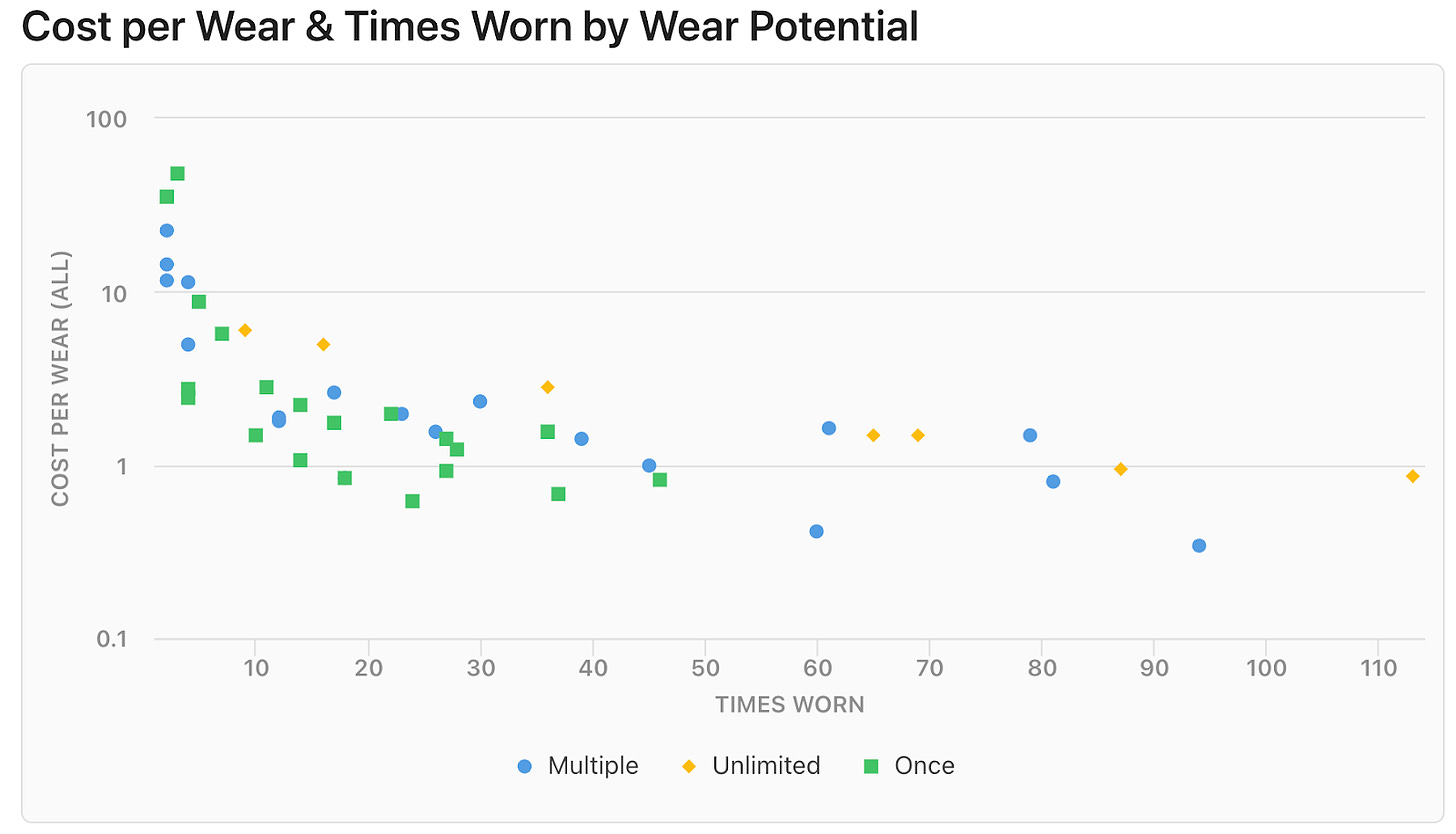
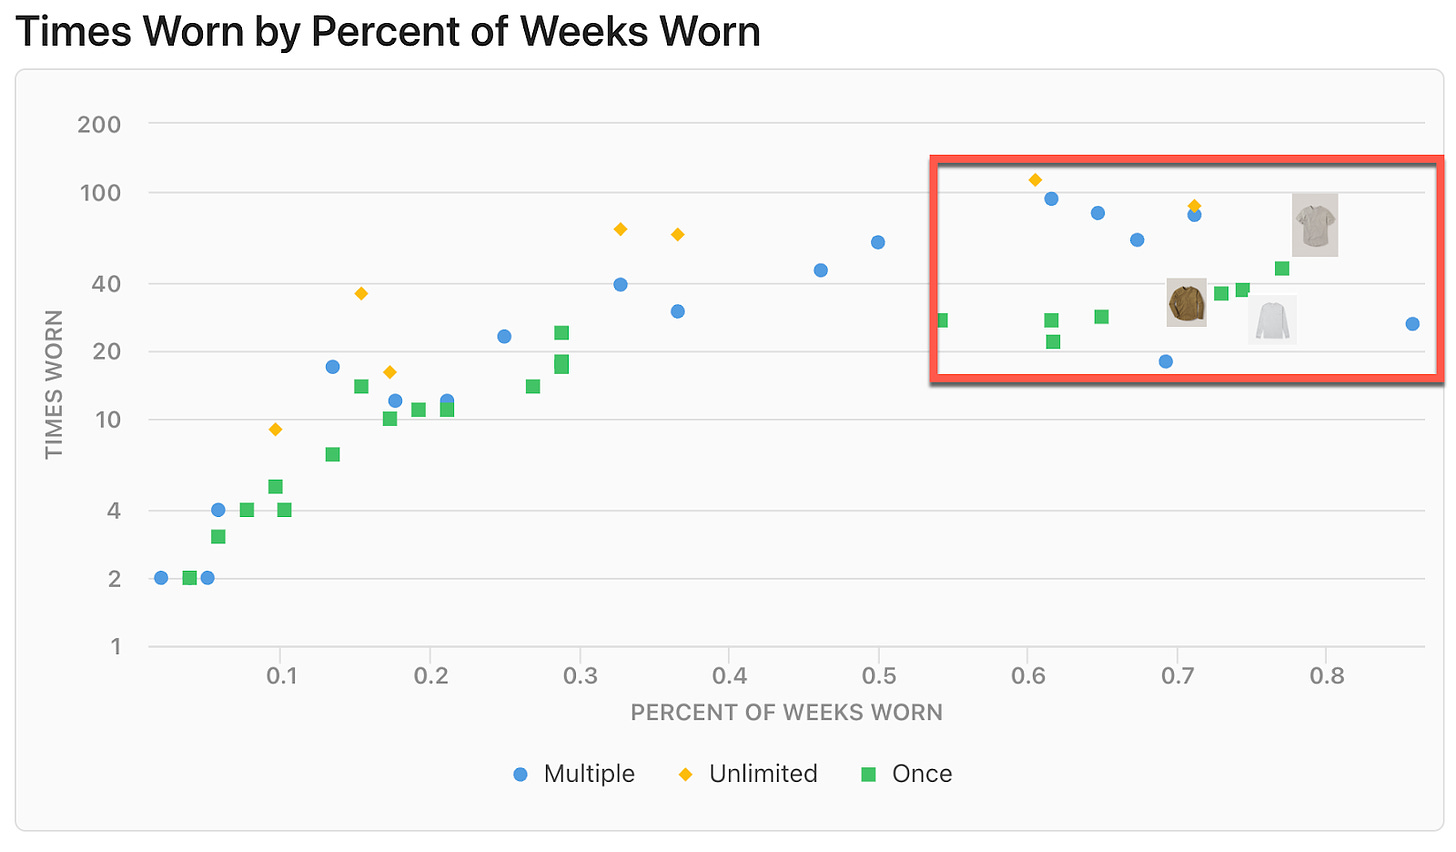
The cost per wear is the retail price (retail in this case is typically what I paid or if it was a gift or company swag an estimate) divided by number of times worn in 2021. This is only counting 2021 wears and the majority of items were purchased pre-2021. Percent of weeks worn is looking at the weekly participation rate of a piece of clothing divided by the number of weeks it was owned. Or in english; what percent of weeks did I wear this item at least once.
Items I Never Wore
“Does this bring you joy?” Knowing that you went an entire year never wearing something really makes the decision to get rid of something easier. Still there were a number of items I still wanted to hold on to. Some for practical purposes; i’ll need dress shoes once every other year. Others for aspirational reasons; sure i’ll use those exercise shirts more in the future. Those $200 pair of raw denim will eventually get worn.
How did Track Everything?
The used NFC buttons + Apple Shortcuts + Coda.io. (Technical Implementation Instructions in Coda)
In the future doing something like this will be easy. I can imagine just standing in front of a mirror with a built in camera and AI automatically tracking everything for you. I think you can already do this using Google’s freely available tools. Unfortunately I am not smart enough to be able to build something like that. But I was still very much wanting a semi-automated solution.
The most common automated solution I found in my research involved attaching RFID tags to clothing, either fabric tags or metal strips sewn into collars. Then there would be some type of antenna or scanner that would read the RFID as it passed by. The idea of rigging $1,000+ antennas around my closet just didn’t seem practical (although I did consider it).
My next idea was NFC tags. Essentially the technology that allows you to tap your phone to make touchless payments. Since most phones today already come built in with NFC readers, if I could figure out a way to attach an NFC to all my clothes as well as a way to make the action of scanning the NFC add a log into a table I would be set.
I wasn’t sure if I could find something that would survive washing machines and dryers. So naturally I hit up Alibaba and was able to find lots of different options that seemed to be able to survive the washing/drying conditions. Everything from NFC stickers, tags, and buttons were available . I ordered a few samples of the different options and after some testing the buttons seemed like the perfect solution! So I placed a bulk order for the NFC enabled buttons shipped straight from Shenzhen.
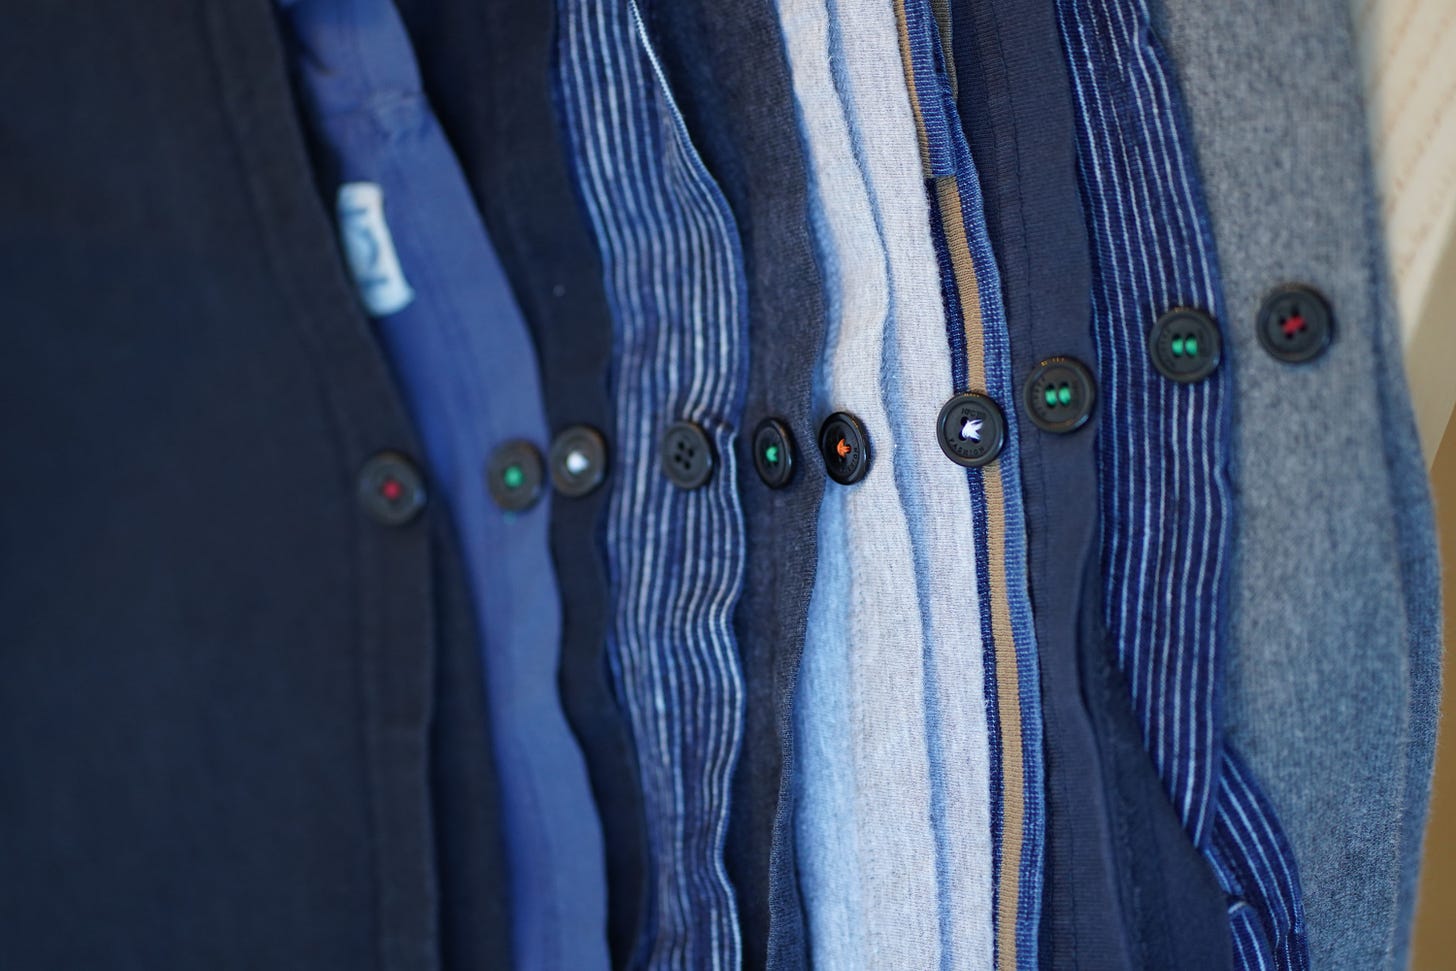
Then I got to sewing. And sewing, and sewing, and sewing. I decided to sew the buttons on the outside of my clothes. I figured it would be a strange conversation starter. Fortunately they would never really be seen due to covid pushing everything over Zoom for the entire year.
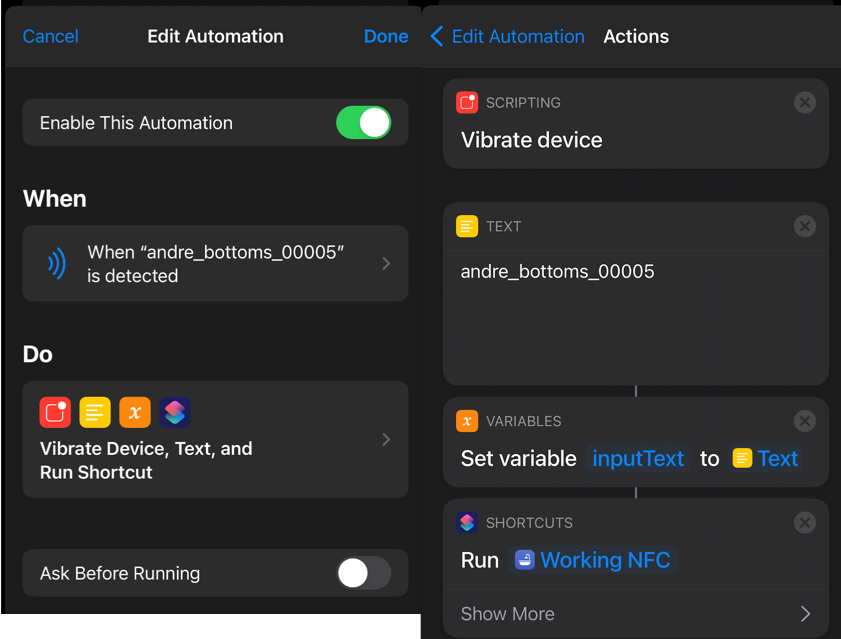
The NFC+ Apple Shortcut Automation Looks Like this:
Essentially you scan in an NFC button, have the action of scanning the NFC start the script which does the following:
Vibrate your phone
Set the Text to the itemid that matches the clothing in my Inventory document.
Set the variable inputText to the above Text
Run the previously created Shortcut which includes all the Coda API information to update your doc with the item it in the wearlog after each scan in.
The way that it all would work was that each article of clothes would have an NFC button sewn on it. I would use Apple Shortcuts to create a program that would automatically add a row into a Coda.io Wear Log. Each article of clothing had its own unique ID which was hard coded into the Apple Shortcut (so nothing was actually written on the NFC itself).
If you are interested in testing out an NFC button for yourself I have a few buttons left over. Just drop me $1 and I’ll send one over, I have 20 left. You can also access the full Coda doc I used to Automate my Wardrobe Tracking which has the full year of data and instructions on how you can replicate it.
Sewing NFC buttons is ridiculous, do you have a way to do this without needing to import hundreds of buttons from China?
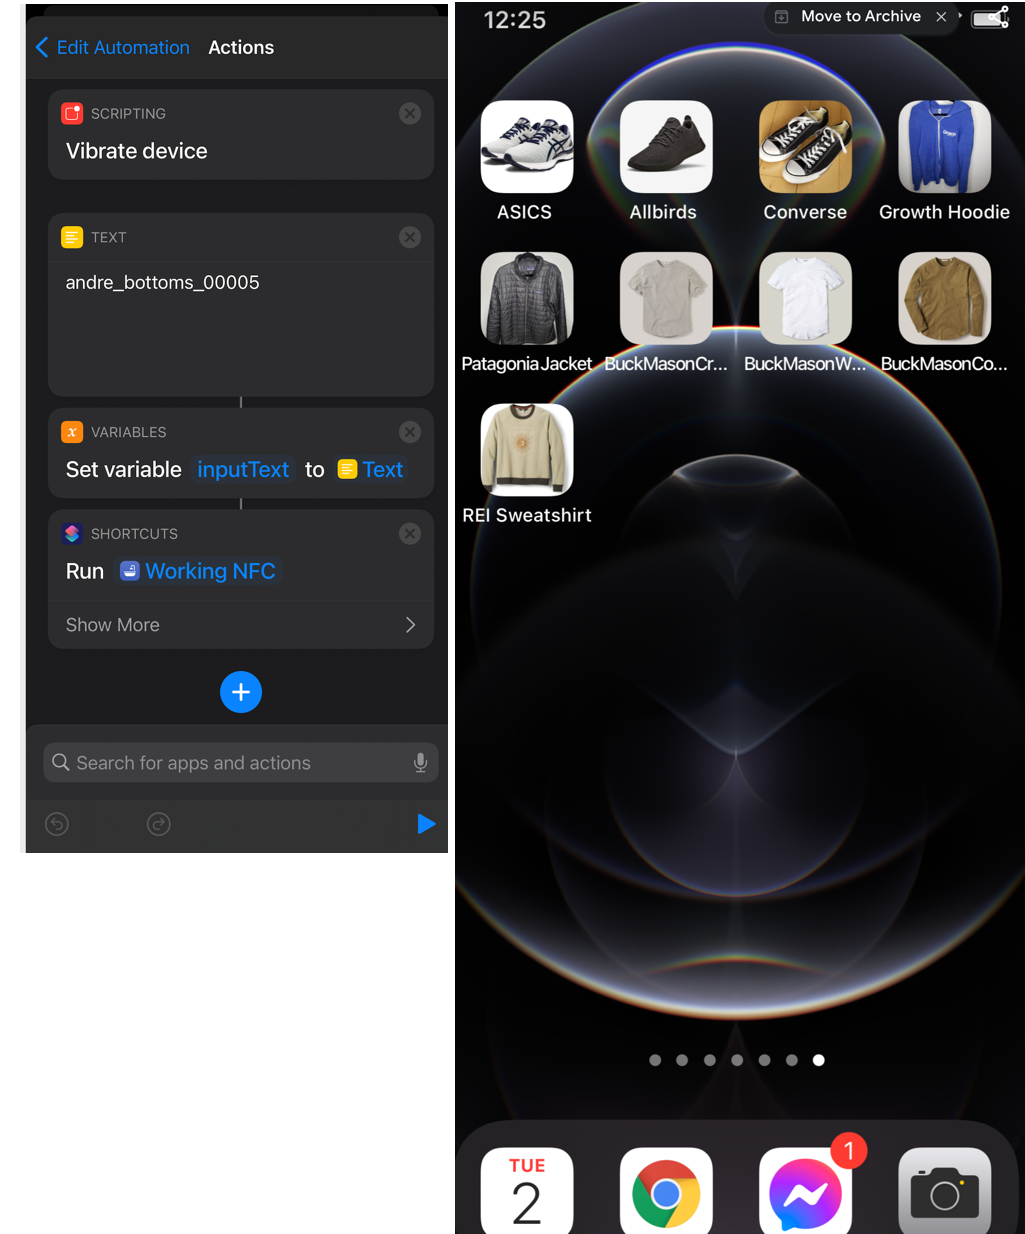
Yes! Apple Shortcuts + Coda is a really cool way to manage/track and log things. Instead of having the NFC trigger you can create a normal Shortcut with the itemid hard coded and add the icon to your phone homescreen. I have done this with a handful of clothing/shoes that I didn’t want to sew buttons to yet. So I just need to click the icon of the item I am wearing and it automatically gets logged into a Coda table.
Deeper Dive into Trends
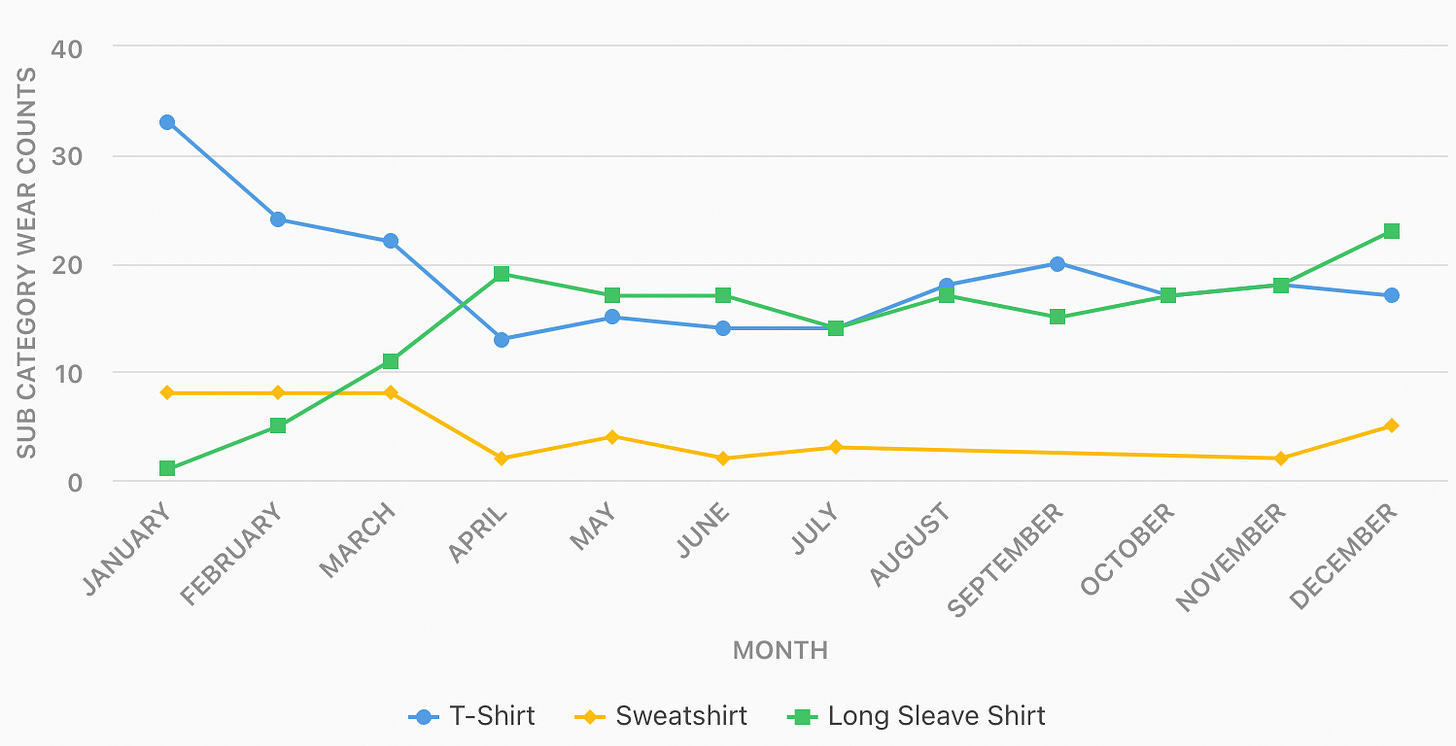
Shirt Trends
Outside of the general observations above I found my shirt trends really interesting. There were a handful of mostly newly acquired shirts that made it into the weekly rotation. With 7 shirts getting worn at least once in nearly 50+% of weeks they were owned. Was fascinating to see how color played a big part in wear rates as well. My theory here is simply that my household doesn’t own enough white clothing items so the “white load” of laundry is bi-weekly vs weekly for everything else.
There isn’t very much seasonality in shirts. Particularly when a hoodie or light jacket is enough for most San Francisco days.
There was another interesting trend that jumped out when I was trying to identify factors that influenced higher weekly penetration rates and lower cost per wear; the size of shirts. Or to put it another way, apparently size matters.
The far right is items with high weekly penetration rates and lower cost per wear. They are nearly all size Medium.
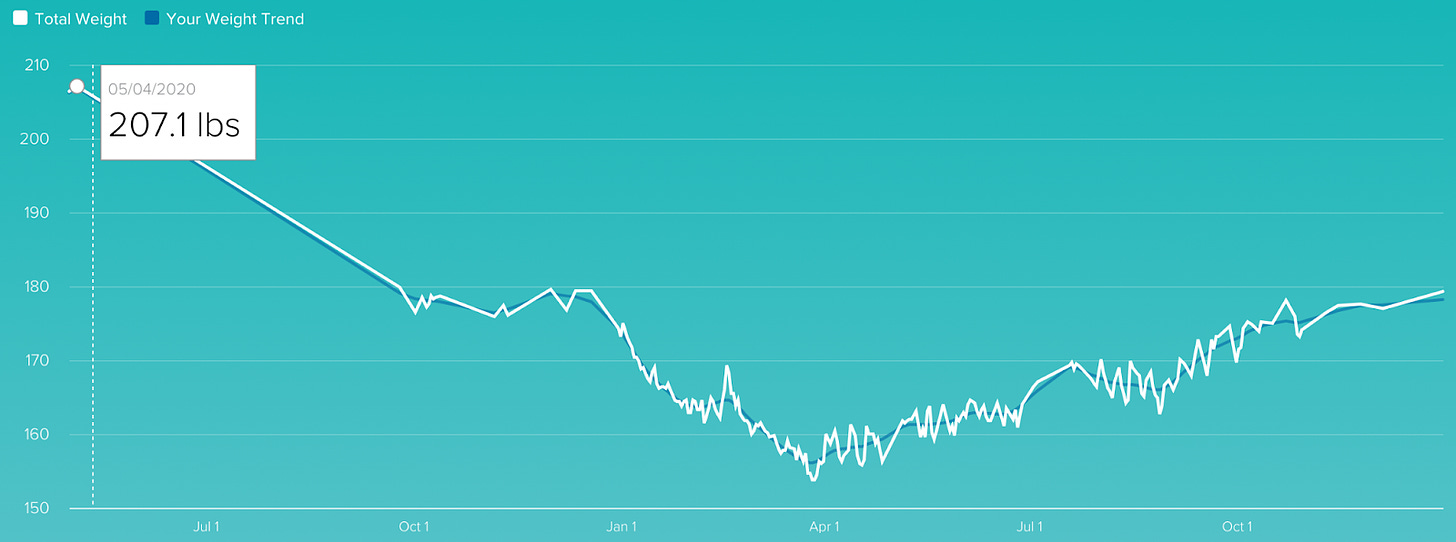
You see I made a few lifestyle changes the year before and dropped a decent amount of weight. This left me with a lot of really poorly fitting clothing. I was surprised to see how much I stopped wearing the larger sizes once I could fit back into a Medium. Looks like I can probably purge the majority of XL items and some of the L items now.
Shoe Trends
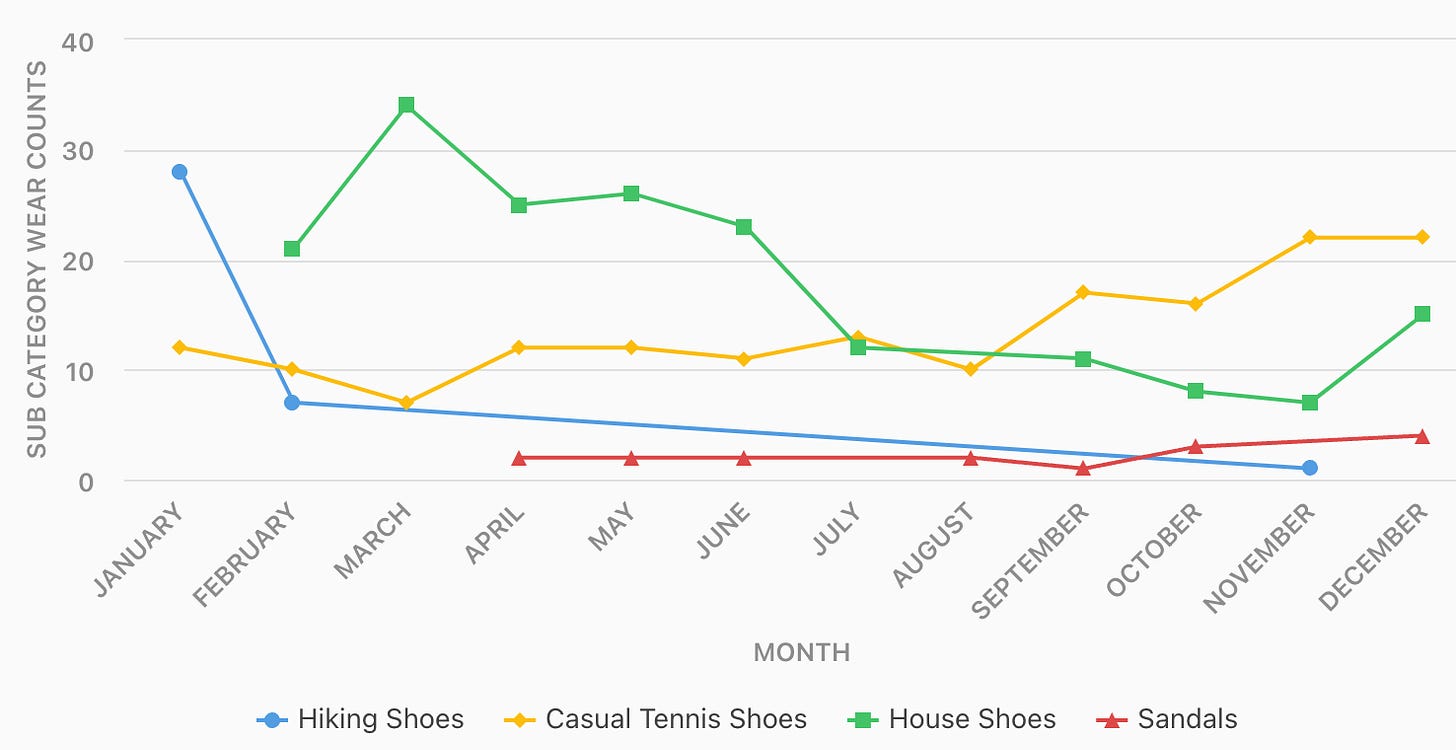
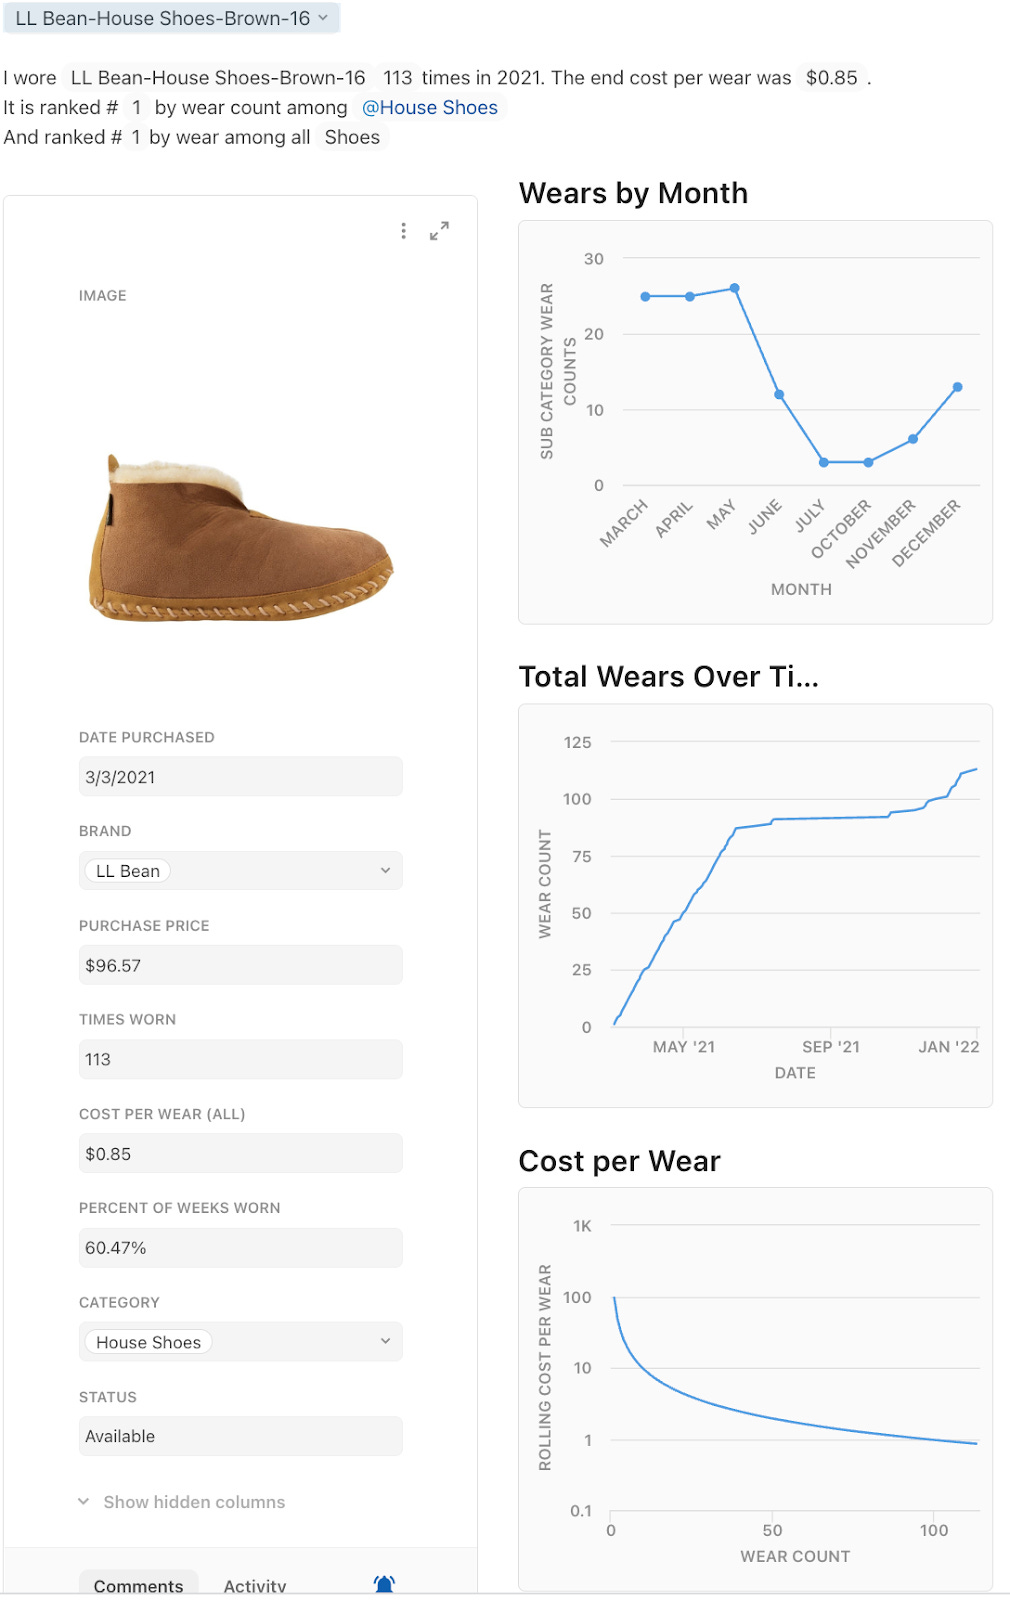
I guess we need to talk about shoes. I ended the year with 9 shoes after donating 6 pairs that were never worn. With working from home due to covid, 2021 became the year I discovered house shoes. The LL Bean Wicked Good Slippers were the number one most worn item across every category. They were worn at least once in 60% of the weeks they were owned. I also cleaned my AllBirds and made them dedicated house shoes as well. I am also happy to see high weekly penetration rates for my Casual Tennis Shoes. That means I left the house at least once most weeks! Or actually looking at the data more closely I wore shoes I could go outside in 188 days last year.
Looks like I did a lot of hiking in January? What actually happened is I somehow ended up with turf toe from chasing my toddler around the house barefoot every day. I subbed the hiking shoes in as sturdy stabilizing boots while my toe healed.
Trends in Pants
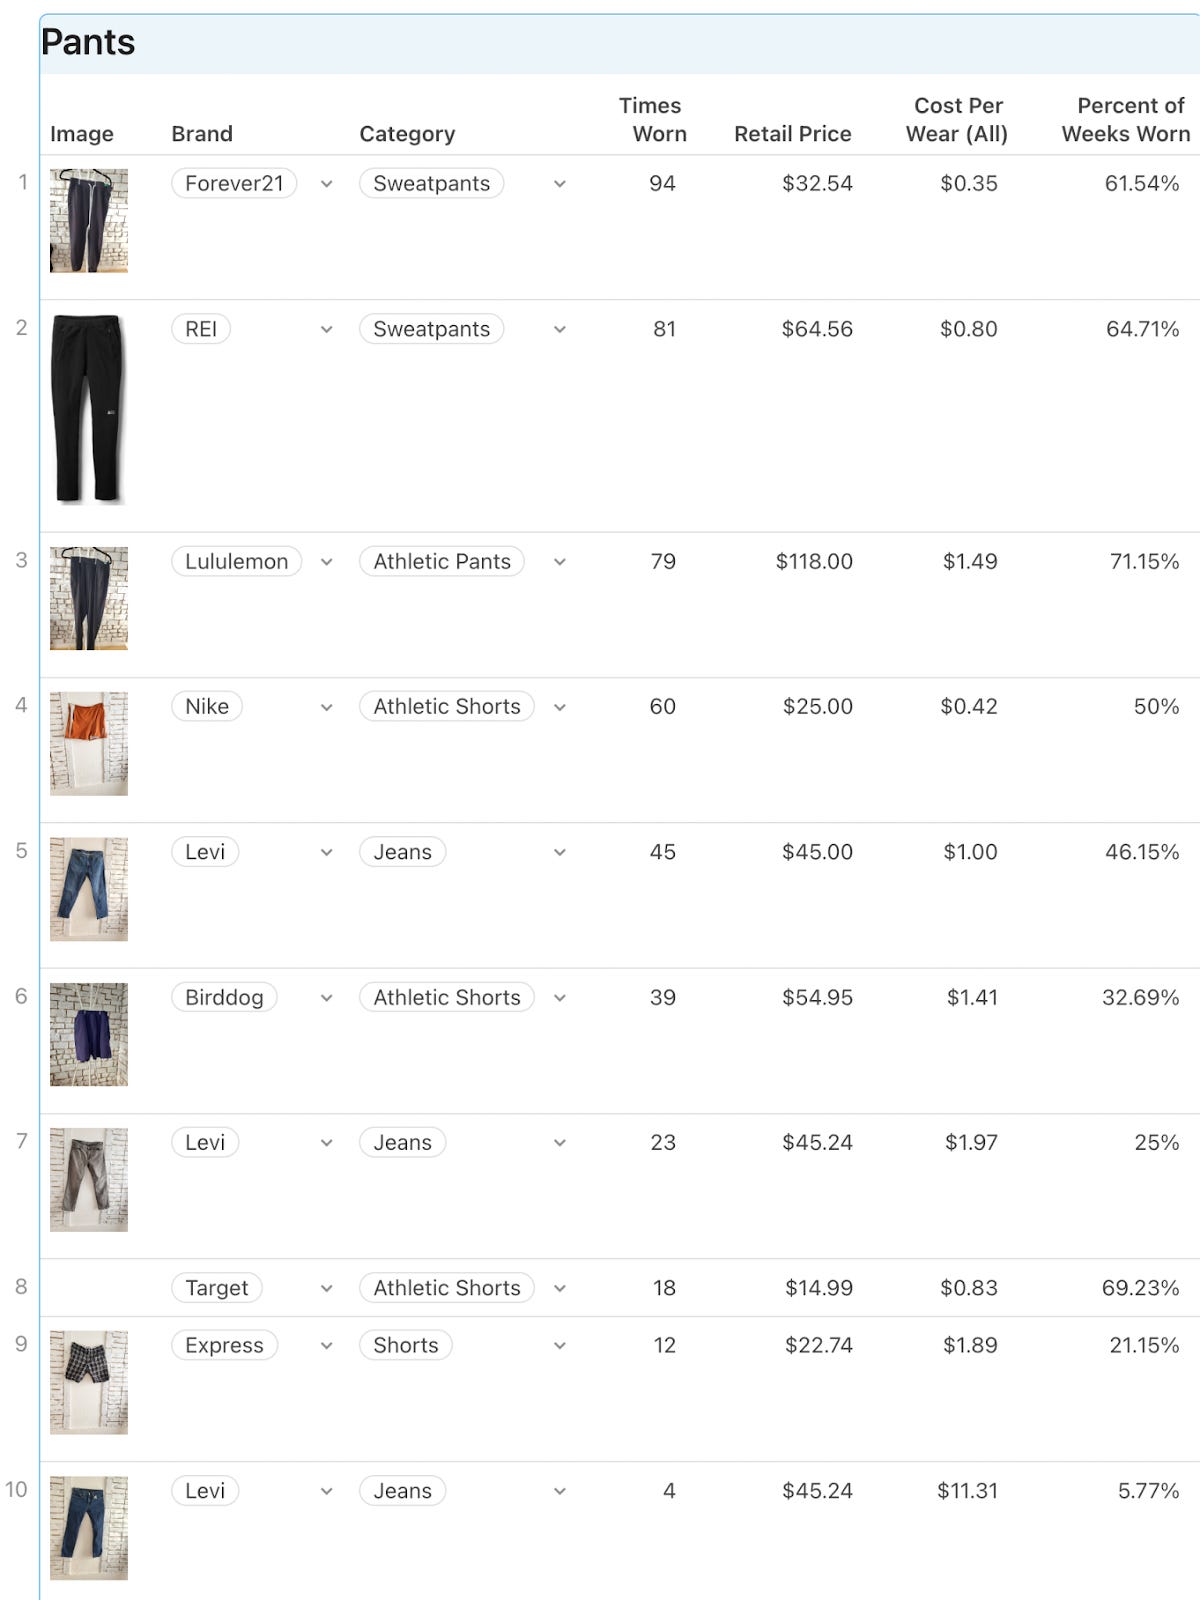
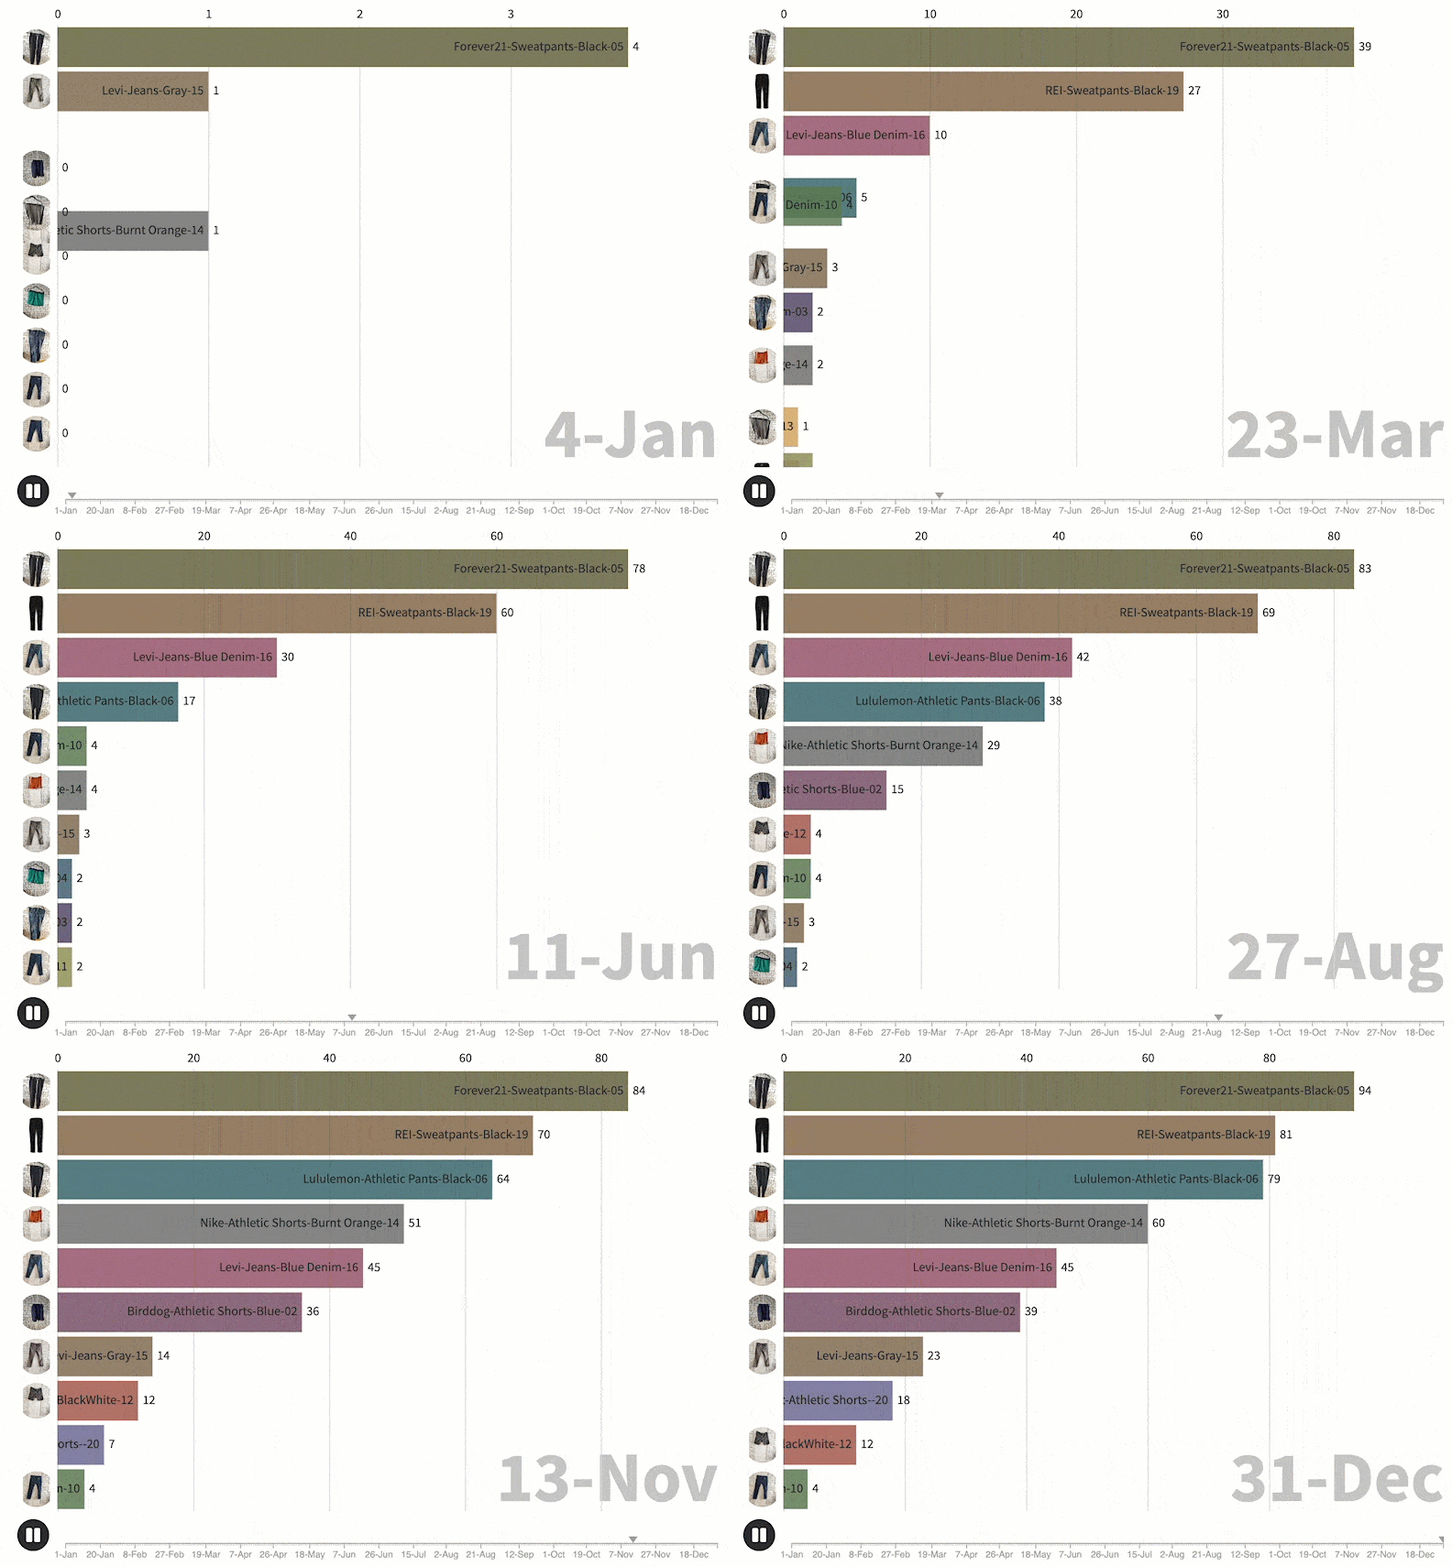
The first major change that resulted from logging everything was the realization that everyone would soon know that I was wearing the same pair of Forever 21 joggers (aka sweatpants) way too often. That resulted in a quick trip down to REI where I added another pair of Sweatpants into the rotation to make me feel slightly less shameful.
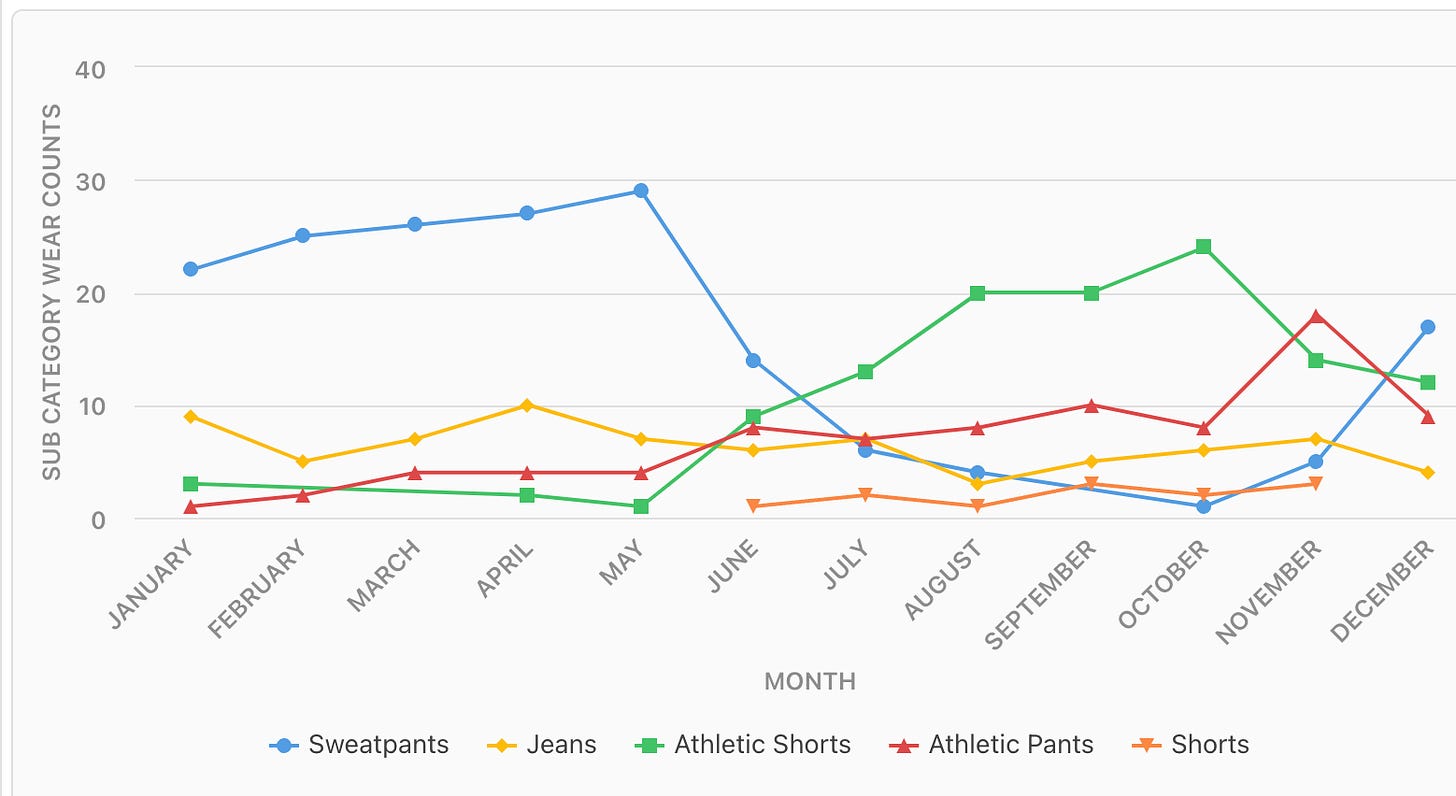
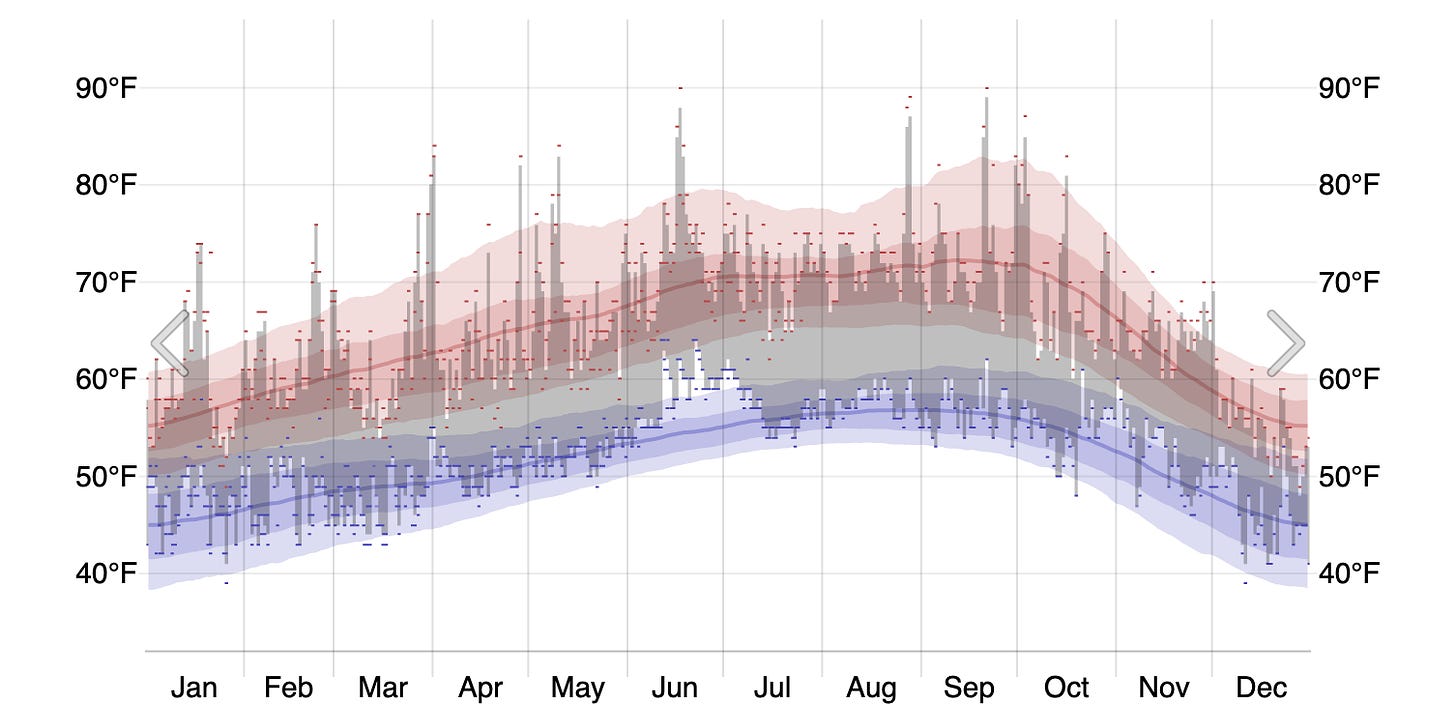
It was very interesting to see how Sweatpants were cannibalized by Athletic shorts as soon as the weather started getting warmer in June. I am even seeing the exact same trend in usage now where I am wearing shorts or my Lululemon athletic pants way more often the past 30 days than the entire year combined.
San Francisco weather trends from 2021 © WeatherSpark.com.
Clearly when the average high in San Francisco approaches 70 the sweatpants get replaced with either “Athletic Pants” or “Athletic Shorts”. I spent the end of 2021 in Texas which explains why sweatpants didn’t make as large a comeback as you would expect.
Frequency Trends
Looking at a histogram of how often items were worn (excluding those worn 0 times) I was surprised at how much of what I own was worn 5 or fewer times. Having fewer things in the 5 or less bucket seems to be a big opportunity. While it might also be appealing to try and increase the number of items worn >50 times, I would need to be cautious at how I did that. For example 4/9 of the items with >50 wears are shoes. If I buy more shoes it would likely lead to a decrease in the number of any individual shoe being worn >50 times.
Which brings up another interesting observation. Some items can be worn multiple times per week while others probably only once. Shirts I would typically wash after 1 wear. Jackets, Pants, and Shoes in many cases can be worn multiple times in a week without needing washing.
Once: Most Shirts
Multiple: Jackets, Sweaters, Pants, Shorts…
Unlimited: Shoes
If I were to purchase something new, looking at the items that can only be worn once yet have high weekly participation could be one way to approach it. The maximum number of “Once per week” items in the same category would be ~14 to get all of them at 50% weekly usage. Granted this really only works in a place like San Francisco where the weather is fairly consistent year round.
Individual Item Stats:
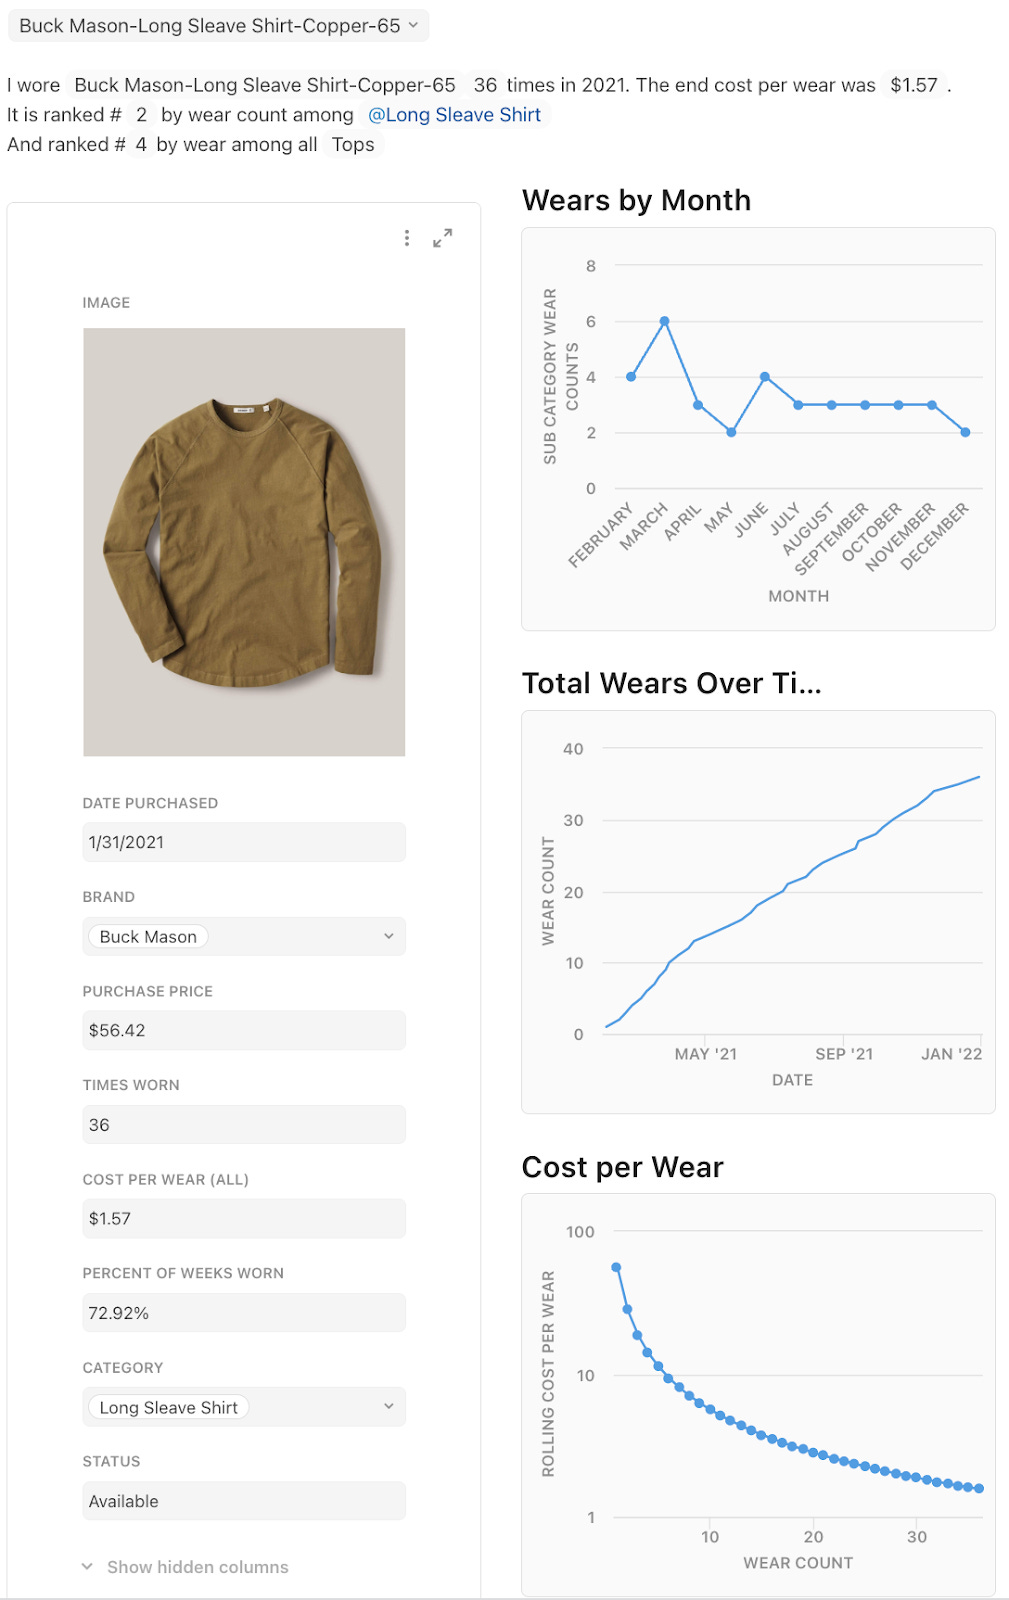
I also created a dashboard that lets me break down each individual item, because why not.
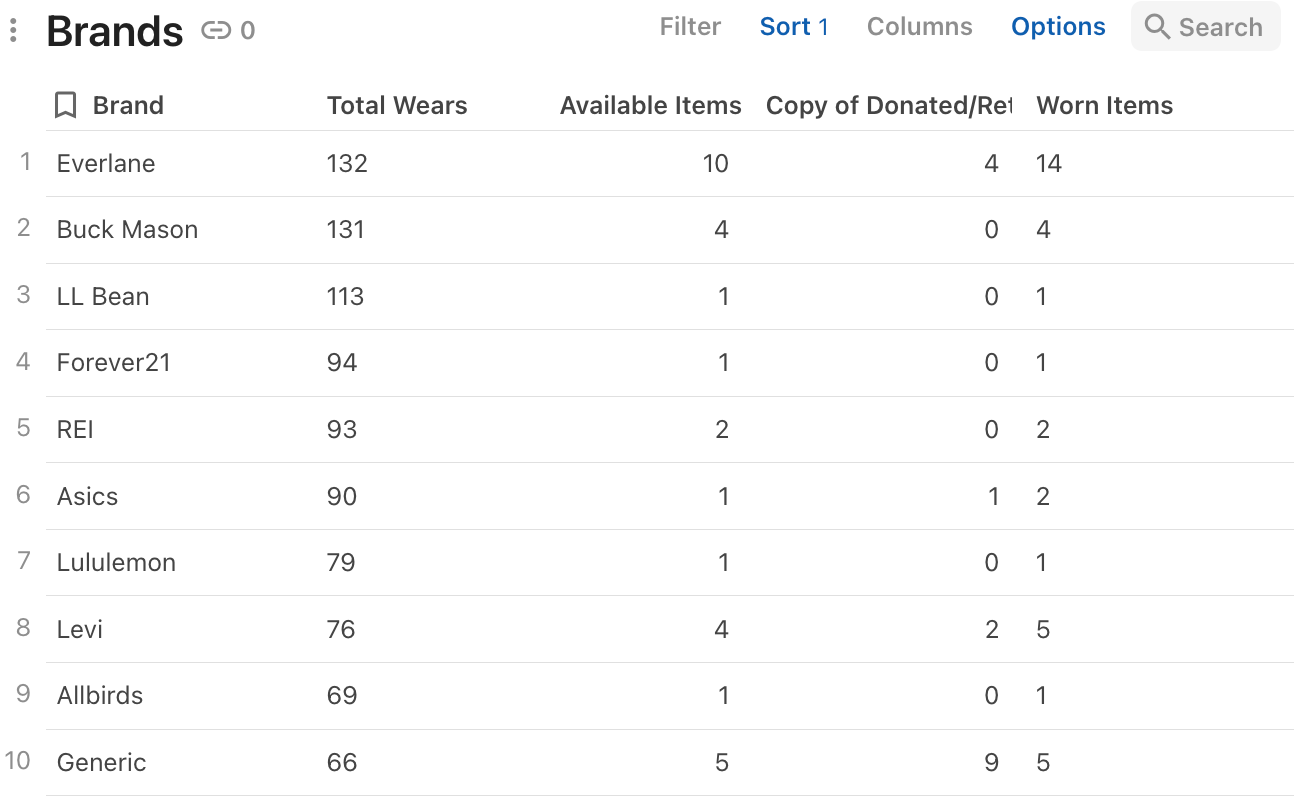
Brands Usage
Impact of Understanding Wear Patterns
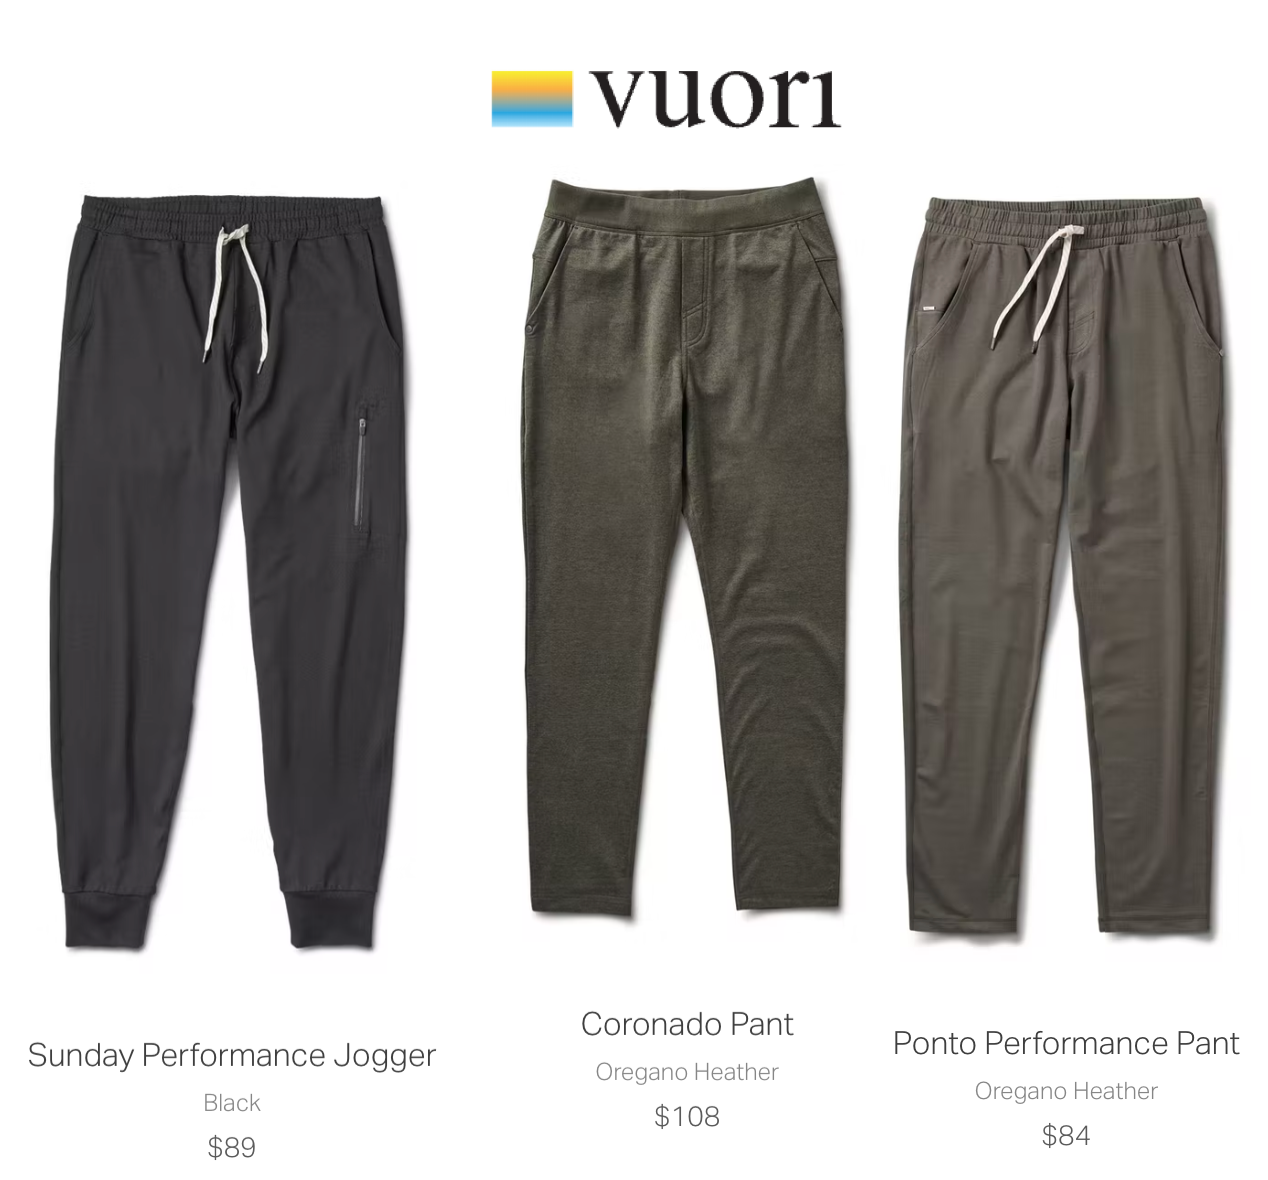
One immediate impact from this analysis was that I came into Christmas 2021 prepared. I had some easy answers to the questions of what I wanted. More medium t-shirts and long sleeve shirts from Everlane and Buck Mason as well as some additions to my sweatpants collection. Knowing how often I wore them made me feel better about buying higher quality items that I normally would never buy. I am now the proud owner of 3 pairs of Vuori sweatpants/athletic pants/joggers.
Am I going to keep tracking things?
Well if you can’t tell by the data I stopped tracking things as soon as 2021 ended. I was determined to go an entire year but was happy to stop as soon as the year was up. I also didn’t really want to look at the data for a few months. It was a little overwhelming knowing it took an entire year to collect all the data. Now that 6 months have passed I can come back to it with fresh eyes again.
It was a fun little project that pushed me to find creative ways of blending what was happening in the physical world with the digital world. I remain very bullish on a future where individuals can personally track everything in their own environments. If you see interesting projects in this space be sure to send them my way!
I’ll also plug again that if you are interested in testing out an NFC button for yourself I have a few buttons left over. Just drop me $1 and I’ll send one over. At the very least if you have an iphone you can do some fun things with Apple Shortcuts. Here is the Coda doc that includes more details on implementation.
Want even more clothes tracking? My buddy Olof in Finland has been tracking for 4+ years now. You can look at his logging, data, and full github repository.







Cool use of Coda.io!
Fucking genius